
In this blog post, we discuss the capabilities of the new Dimensions Knowledge Graph and how it helps organizations overcome persistent data challenges in the pharma space and power use cases across the entire pharma value chain. Keep reading!
Introducing the Dimensions Knowledge Graph: Powering AI solutions in pharma by harnessing internal knowledge & global research data
With the launch of the Dimensions Knowledge Graph, powered by metaphactory, companies in the pharmaceutical and life sciences fields can gain unparalleled access to an abundance of interlinked global research data covering around 350 million records, such as patents, clinical study reports and publications as well as public datasets and ontologies, that they can now use in conjunction with the wealth of internal data they already possess—from internally-conducted research to information captured in documents and presentations.
In addition to making global research and public data available for integration with internal data, the new Dimensions Knowledge Graph is an all-encompassing ready-made knowledge graph enabling AI solutions in pharma. Through a unified semantic layer, it connects data across all relevant sources and adds richness and context that simplifies and accelerates the generation of actionable insights grounded in evidence.
In this blog post, we discuss the capabilities of the new Dimensions Knowledge Graph and how it helps organizations overcome persistent data challenges in the pharma space and power use cases across the entire pharma value chain. Keep reading!
Table of contents
The Dimensions Knowledge Graph
We’re thrilled that, as of today, the Dimensions Knowledge Graph is now available for use for organizations across pharma and life sciences.
The Dimensions Knowledge Graph is an all-in-one knowledge graph solution, ready-made for easy integration with your organization’s data infrastructure and existing internal knowledge graphs. At its core is an explicitly defined and flexible semantic model that can be easily extended to include your internal data (which can range from domain expert knowledge or data from internal documents) and harness the synergy of global research and your internal knowledge to drive business decisions.
If you’re not familiar with semantic knowledge graphs, they offer endless opportunities to help companies make sense of their data, extract actionable insights, share it with relevant stakeholders and make it human- and machine-interpretable to power intelligent applications. You can read more about semantic knowledge graphs here.
The model for the Dimensions Knowledge Graph was built using metaphactory's semantic modeling interface, which is based on open standards and supports data reusability across all use cases and domains within an organization, as well as extensibility to enable the capturing of internal data. End users can access the integrated knowledge through use-case-specific views for intuitive search, exploration and visualization. Alternatively, insights can be delivered via API and injected into already-established Business Intelligence or data visualization interfaces.
The built-in AI Assists across the solution can deliver trust and explainability to AI-generated insights and help scale business decisions, allowing you to move from a human-driven model to a human-in-the-loop model.
We believe the Dimensions Knowledge Graph is the largest interconnected set of semantically annotated knowledge, including data from:
-
143 million publications
-
160 million patents
-
30 million datasets
-
7 million grants
-
2 million policy documents
People & organizations
-
34 million researchers
-
129 thousand organizations
Semantic annotations
-
307 billion linked semantic annotations
-
35 million research integrity trust markers
Pharma ontologies/vocabularies
-
30 million concepts from 38 domain ontologies
With the Dimensions Knowledge Graph, internal data becomes contextualized and consumable, and enhanced with knowledge from public data and global research knowledge. Through the integration of the Dimensions database and open datasets, you can uncover insights that may have been previously inaccessible and could lead to remarkable solutions and discoveries, and support quick validation of hypotheses.
Building on Dimensions data
The Dimensions Knowledge Graph data is built upon one of the world’s largest linked research databases and includes data covering millions of publications, patents, grants, clinical trials, policy documents and technical reports. The Dimensions database not only enables search on the metadata of publications (e.g., title, abstract, authors), but it also offers search and discovery over full text.
The Dimensions Knowledge Graph enhances Dimensions data by offering integration with public datasets and ontologies, including data, metadata and relations for genomics, proteomics, metabolomics, molecular interactions, biological processes, and pharmacology and includes metadata and semantic annotations derived from 350 million research outputs. Additionally, you can easily combine this data with internal data or any existing knowledge graphs you wish to integrate.
As you continue reading, we’ll uncover why the Dimensions Knowledge Graph is uniquely capable of supporting many use cases in the pharma space, enabling complex pharma workflows and powering trustworthy AI solutions that you may have already been considering.
Making critical decisions in pharma
It may be obvious and too simplistic to say that making deliberate, smart decisions in business is critical to success, but when boiled down, significant business accomplishments are a result of a series of intelligent decision-making. When done without leveraging enriched data, it can have major implications.
This rings particularly true in the fields of pharma and life sciences, where the decisions required are especially complex, yet capable of life-changing impact. Such decisions can range from deciding whether to invest $10M or $100M and how to allocate this investment between one particular research area over another. If these decisions are made with contextualized knowledge, they could lead to unbelievable discoveries such as the development of a life-saving drug, or result in new findings about a pervasive disease.
To make these critical decisions, most rely on ‘data-driven’ decision-making, however, we argue that being data-driven isn’t enough, especially with stakes this high. Instead, what is needed is knowledge.
From data-centric to knowledge-centric
Data alone is simply a raw good lacking any value if it can’t be understood or interpreted. There is an overabundance of data and a plethora of ways and tools to accumulate such information. The true value of data lies in the existing relevant context around this data, such as understanding where the data is from, how it was collected or the initial purpose of its collection. This context can say even more about the data than the data itself and transforms it from hard, raw numbers to insight and knowledge.
Relying on raw data as a guide to smart decisions is like relying on a map with no legend. The map would be an array of colorful images and symbols with no way to interpret them, making it impossible to figure out the best way forward. Moving from a data-centric to a knowledge-centric business gives you a clear picture of your data and what it means for your organization so that you have a reliable road map for decision-making. This article featured in Digital Sciences’ TL;DR Spotlight series explores the different types of fragmentation that exist in the pharma and life sciences space that hinder decision intelligence, which we will also walk through below.
Why data alone is not enough
Only once data turns into knowledge can we better understand the meaning of it and know how to correctly interpret and use it.
For example, take the data point 'p53'. When looking at this text in isolation, it offers very little value and can be subject to multiple interpretations. Does ‘p53’ refer to a page number in a patent? Or is it referring to 'protein p53' or 'gene TP53'? Without additional context and meaning, this individual data point is meaningless. To have any value, it must be transformed into knowledge, which is done by explicitly defining the various entities and relations relevant to this data point. Only then can we derive actionable insights that can be used to power decisions. In the pharma space, this context-sensitive annotation is imperative as mixing up values could lead to significant confusion.
Not having access to the right data
How do we turn data into knowledge? First, we need to solve the issue of fragmentation in the pharma space, specifically between internal and external data, as well as the fragmentation that exists within internal systems.
While most pharmaceutical companies have amassed a substantial volume of valuable internal data, they are missing out on significant opportunities if not paired with global research knowledge and publicly available data. This obstacle is a result of lacking the architecture to integrate and correlate this data with internal data, or rigid data structures that make it difficult to consume and utilize external data in one’s own environment.
Internal data vs. external data
Internal data refers to research and insights derived from internal executions, domain knowledge held by experts within the company and internal documents and papers. External data refers to research and insights conducted by external parties and any dataset with information that is publicly available, such as publicly available ontologies and vocabularies.
Tapping into vast amounts of knowledge, both internal and external, can lead to phenomenal opportunities and discoveries that maybe would not be possible otherwise. Consider this example: By leveraging the EMBL-EBI datasets (which include a comprehensive range of molecular data resources) which are integrated through the Dimensions Knowledge Graph, a researcher investigating target-disease relationships may discover that a particular target that is also present in internal studies and research data, could apply to a disease using an internal compound that has already been tested on that target but not for that disease. Access to such public databases, as well as the contextual enrichment the Dimensions Knowledge Graph provides, facilitates the exploration of these relations that would have otherwise remained unknown. Information garnered from trials and studies initially done internally can then be referenced and validated by studies and information found in existing publications and literature.
There’s much to learn if there is collaboration and access to the knowledge available to us, and not being able to leverage global research and public data represents a missed opportunity. It could have significant time and cost-savings that could speed up drug discovery or reduce research costs.
The problem of too much data
Another type of fragmentation that exists is within one’s own internal systems, which is a natural consequence of there previously being no simple way to share expertise and knowledge. When data is scattered across various systems and departments, it can be hard to retrieve, consolidate and see information from a bigger perspective. As well, there are new types of data being published regularly, making it difficult to keep up with emerging research.
Data needs to be actionable
Having data readily available is the first challenge, the next is being able to utilize it. This need is particularly evident among our clients, who have an eagerness to move toward self-service knowledge discovery. Scientists want to be able to interpret and work with data without having to rely on support from IT or data scientists for data preparation or the creation of views and dashboards. Individuals want to interact with and evaluate data autonomously so that they can effortlessly make decisions without any dependencies.
This is especially difficult when data is hard-coded in software, left in documents and spreadsheets, or only known by specific domain experts. The latter is what we refer to as the Bermuda Triangle of Knowledge Drain.
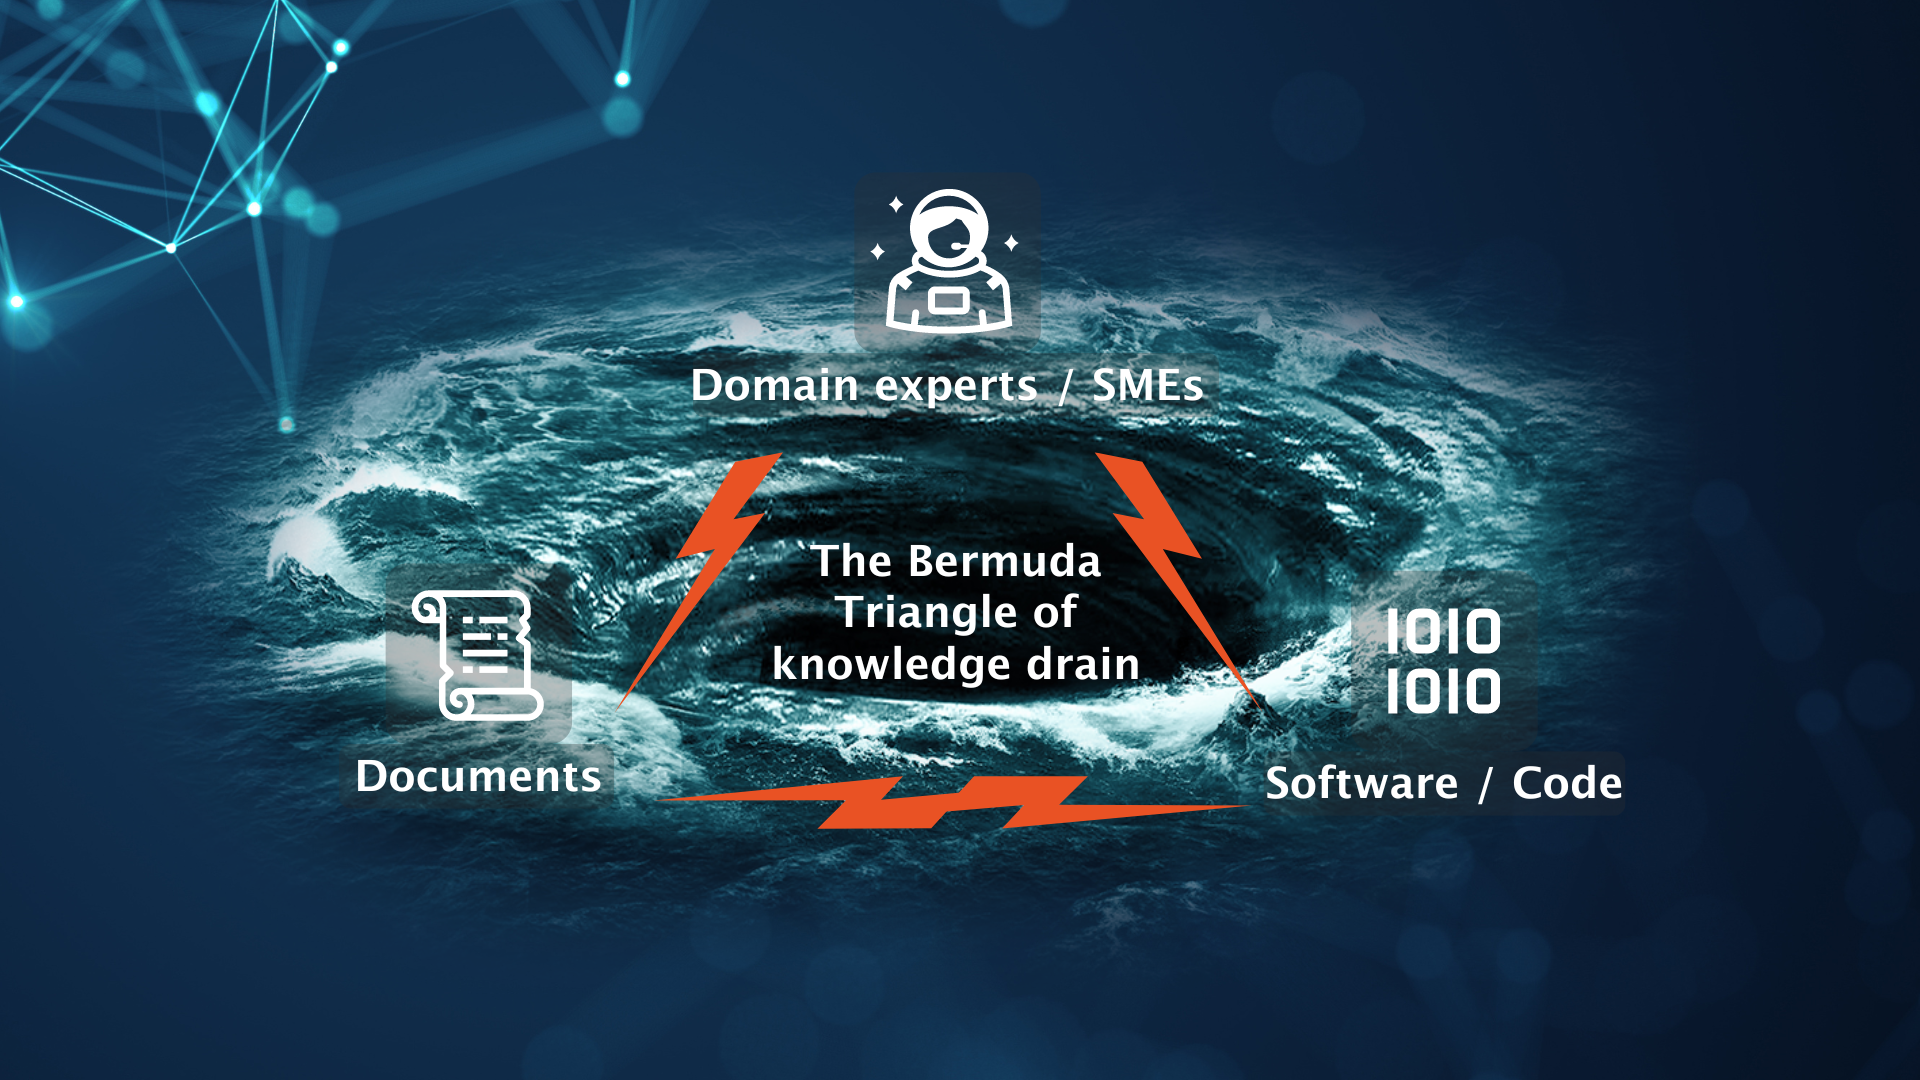
The Bermuda Trial of Knowledge Drain
Domain experts are individuals with expertise in a specific area or have acquired years of experience that only they can share, which often presents the challenge of passing on and sustaining this knowledge within an organization. This ‘knowledge drain’ is prevalent in several industries, from the automotive to the pharmaceutical industry. In these organizations, knowledge is accumulated and retained by individuals who eventually retire or move to competing businesses. This knowledge not only gets transferred elsewhere (where it may benefit competitors) but it also gets lost within the organization. Suddenly, teams are left without the necessary wisdom needed to make strategic decisions, leading to a halt in product development or the complete shelving of these products.
How does the Dimensions Knowledge Graph address these data challenges?
The Dimensions Knowledge Graph addresses these persistent data issues by offering an all-encompassing solution that tackles all challenge areas. Because it is based on a semantic layer that is explicitly defined and flexible, it brings context and richness to data, as well as a unified, user-friendly interface, that all stakeholders can interact with and understand independently. It brings data together across teams and departments so that the entirety of knowledge found within an organization is accessible to all.
The availability of global research knowledge, coupled with seamless integration with internal data, bridges the data divide and eliminates gaps or the possibility of missed opportunities. The Dimensions Knowledge Graph also drives AI support by armoring AI applications such as LLMs or generative AI with a layer of trust and explainability.
Connecting data across silos through a flexible, explicitly defined semantic layer
One of the key strengths of the Dimensions Knowledge Graph is the semantic model it is based upon, which leverages ontologies and vocabularies as well as metadata and semantic annotations derived from 350 million research outputs to explicitly define the research data it represents. Information is contextualized through models describing defined concepts (or classes) such as person, publication and creative work, or gene, protein and drug and by populating instances of these concepts through controlled, hierarchical vocabularies. For example, all instances for the class Protein might be populated by the vocabulary used in UniProt.
The semantic layer also defines the relations between these classes and entities - adding a level of richness that enables you to derive actual meaning and insight from it. Our semantic model can easily align with existing knowledge graphs and models so that even if there are already defined business concepts, it is a simple process to harmonize these concepts and ensure they are consistent across the organization.
Integration of internal data and compatibility with external research information and open datasets is made possible through the flexible nature of the semantic model. It can capture knowledge held across diverse teams and departments and can be fine-tuned to align with your existing data, whether it’s lab data, data from clinical studies or even internal vocabularies (which can then be harmonized with integrated public vocabularies, like MeSH).
Introduces a trust layer that enhances the reliability & explainability of AI, above all other solutions
Through the Dimensions Knowledge Graph, human-generated knowledge and AI applications collaborate to generate trustworthy, explainable, and transparent insights, forming a strong foundation for action and decision-making. We perceive these two components not as separate tools, but rather as the 'two sides of the brain' that complement each other and yield reliable knowledge.
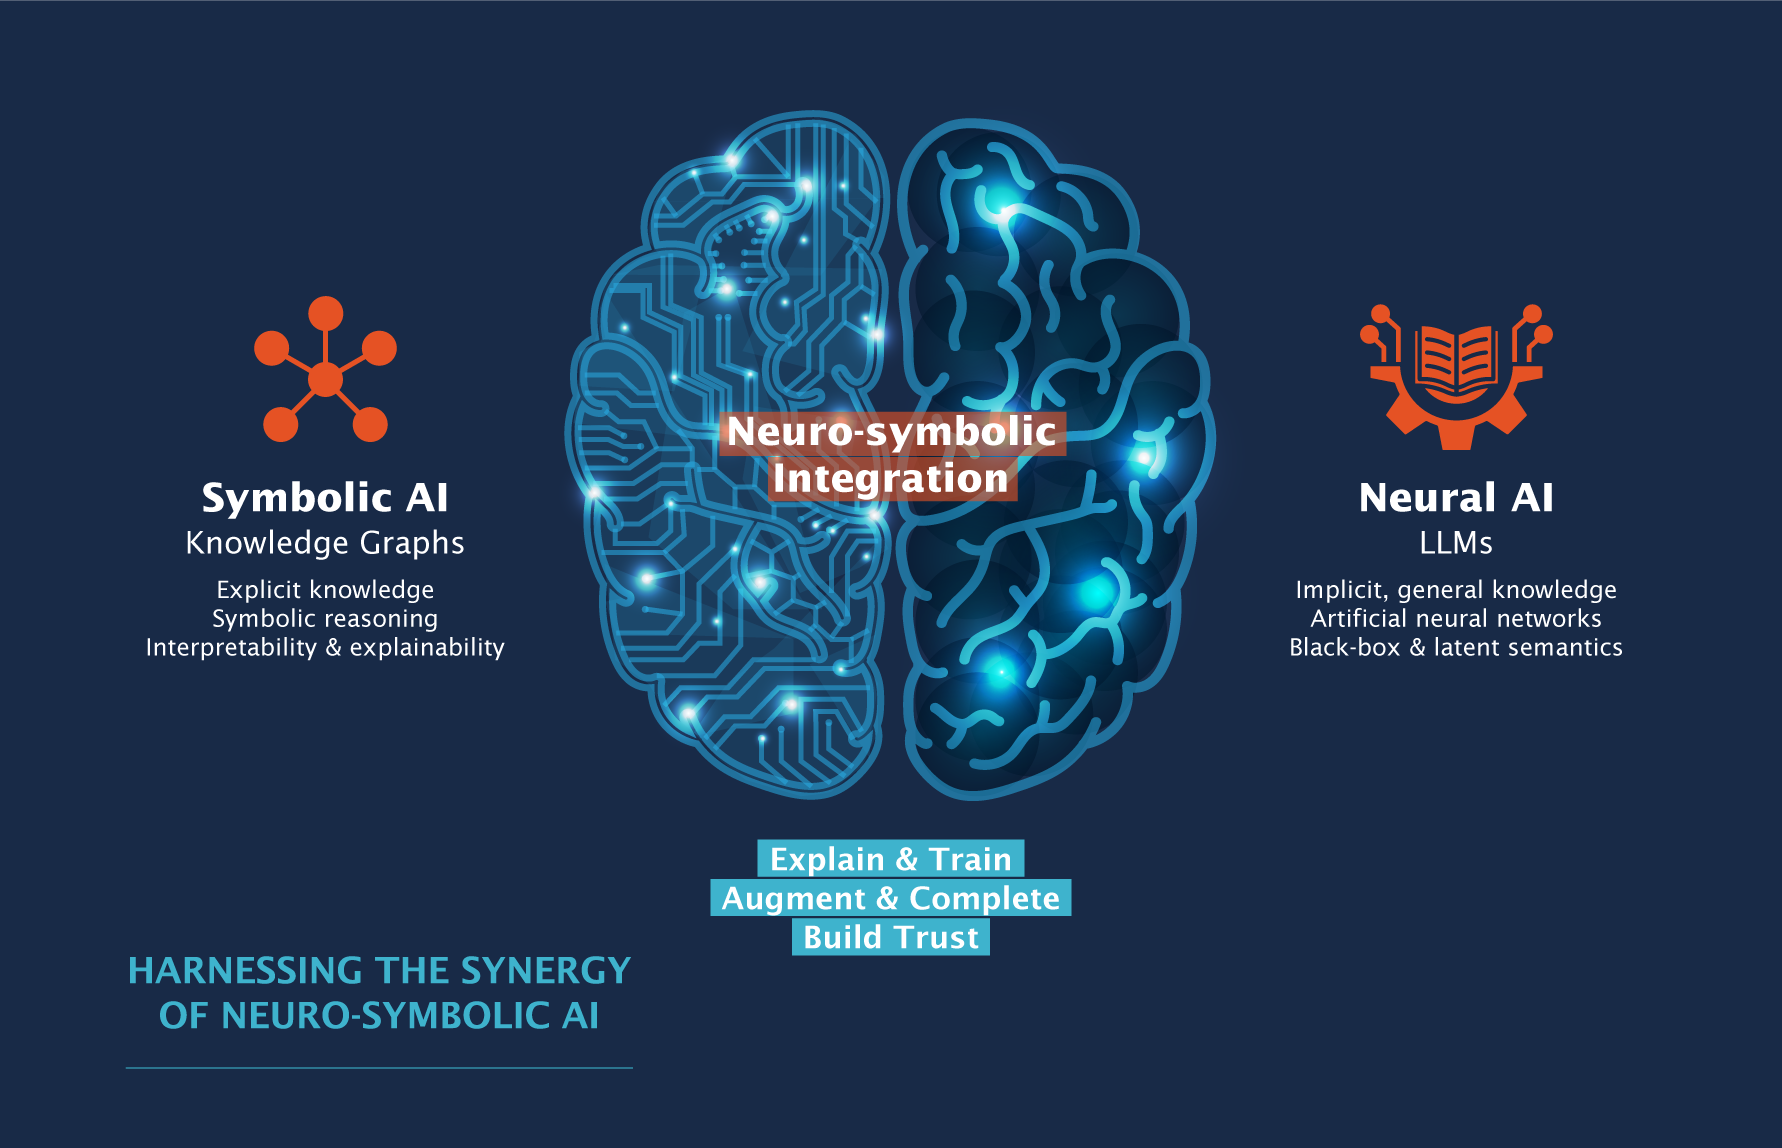
Harness the synergy of neuro-symbolic AI
The left side is where human-generated knowledge lives. It contains pre-wired, connected information and semantic knowledge models curated by domain experts that include their knowledge, expertise and experience. This curated knowledge, which can continuously be extended and changed, is what creates a layer of trust that can be applied to AI.
On the right is the machine side, encompassing automatically extracted knowledge, machine learning algorithms, LLMs and generative AI—models and algorithms that supplement our human-generated knowledge. When both sides work together, we can train AI and ML applications on the trust layer established by the left side, so you can gain peace of mind knowing that insights or outcomes produced by these applications are grounded in evidence.
This symbolic AI layer is a unique component of the Dimensions Knowledge Graph, as it introduces an enhanced level of transparency and trustworthiness to AI applications (e.g., LLMs and gen-AI), which is particularly crucial in pharma due to the sensitive and high-impact nature of its use cases. Companies pursuing independent development of AI within their own systems can benefit from the symbolic AI layer provided by the Dimensions Knowledge Graph, which serves as an essential building block that can enhance the efficiency and reliability of their AI initiatives. The underlying knowledge graph can be combined with LLMs and gen-AI to scale and support business decisions with machine-generated insights, augment explicit knowledge with AI algorithms and much more. This powerful combination of knowledge graphs and LLMs can also drive internal end-user interfaces for knowledge discovery.
The Dimensions Knowledge Graph also offers AI assists to support relation discovery, understanding causes & effects and allowing inference across that information to infer additional facts on top of it.
Unlocking global research knowledge
As we previously mentioned, the Dimensions Knowledge Graph makes data relating to around 350 million records of research knowledge available plus the integration with public datasets, as the largest set of semantically annotated knowledge that we are aware of. This allows you to explore the relations between different publications or literature reviews or between specific proteins and diseases.
For example, it can support hypothesis validation. You can validate a hypothesis, such as ‘Protein A interacts with Protein B, therefore it also interacts with Disease X’, by reviewing available research found in the Dimensions Knowledge Graph. You could cross-reference information in literature reviews and clinical studies or within internal knowledge bases that have previously investigated parts of your theory, to see if it is a true statement. In one knowledge graph, you can consolidate evidence and confidence markers from various sources, enabling you to conduct an integrated assessment.
Leveraging global research knowledge and open data and internal data together enables you to uncover deeper insights and surface relevant connections that can drive complex decisions and solve diverse use cases.
Support across the pharma & life sciences value chain
Since the Dimensions Knowledge Graph adheres to FAIR data standards, data becomes reusable and interoperable within your organization, which is particularly beneficial for the many teams and departments engaged across the various stages of the pharma value chain, as the data generated will likely be needed throughout the entire chain. For instance, data produced from a use case in the R&D stage may be helpful in the clinical trial planning and preparation phase, and all the way to market access.
The Dimensions Knowledge Graph makes it possible for this data to be effectively captured across different sources, consolidated into a centralized system, and visualized through customized views that can serve all relevant use cases.
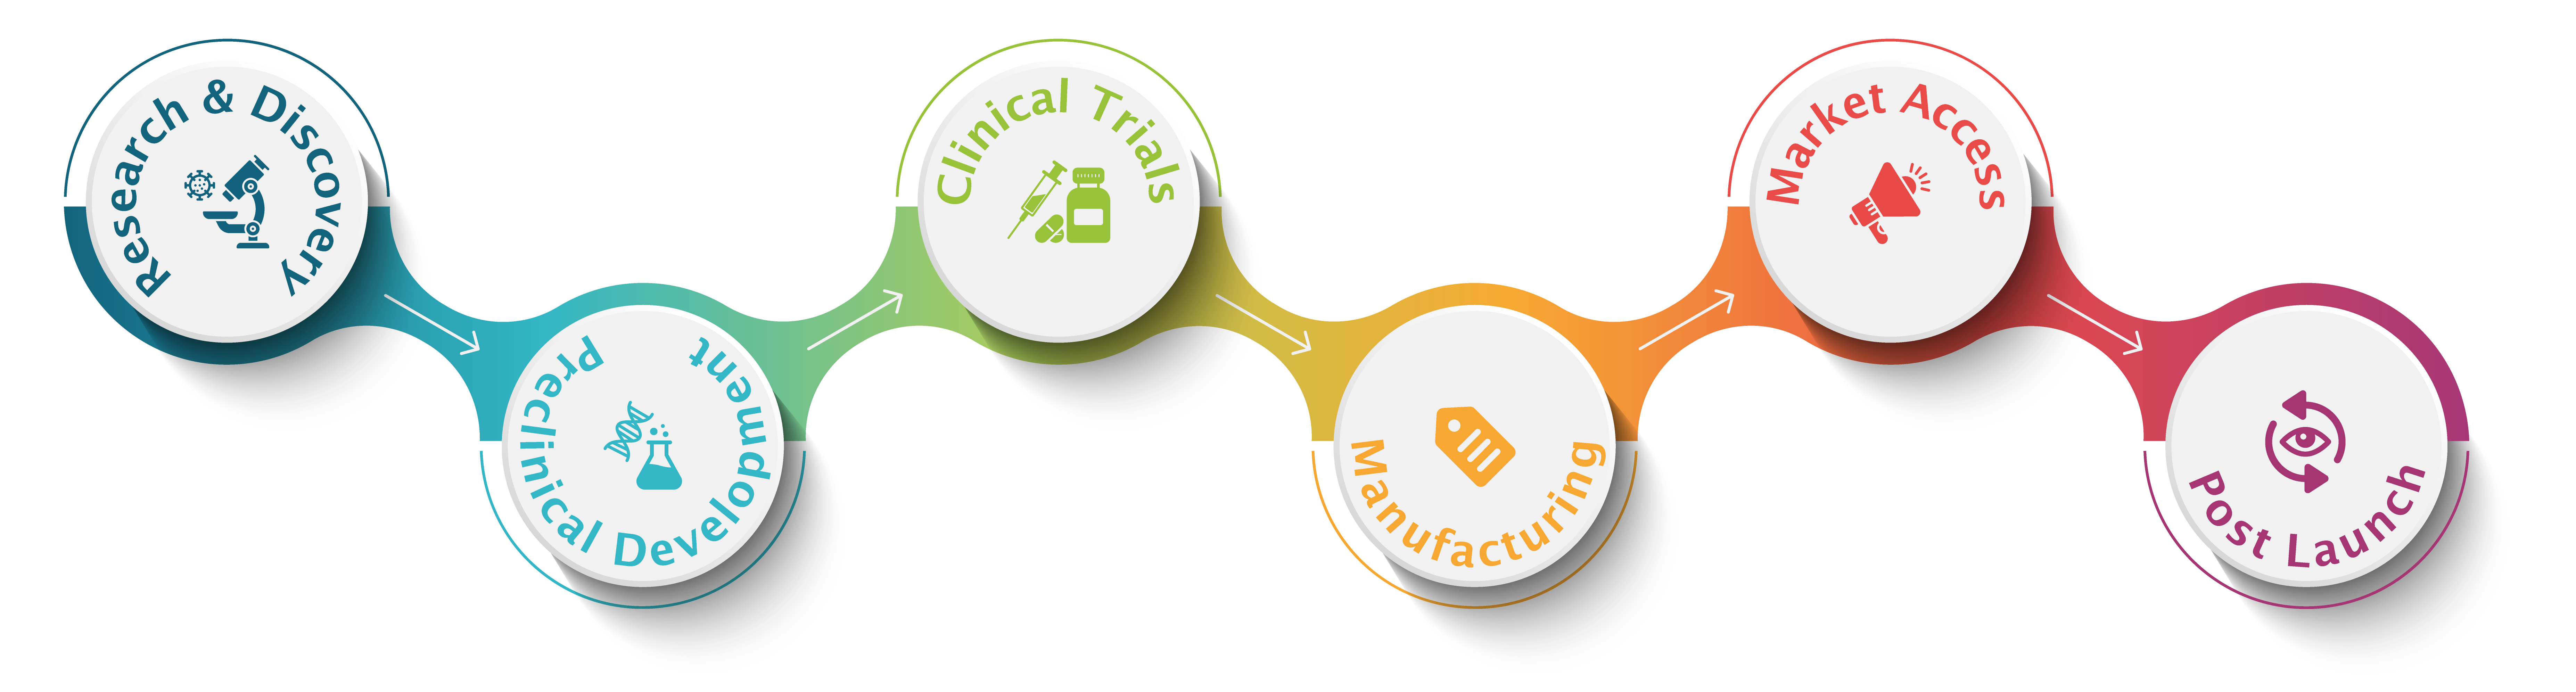
Create value across the entire pharma value chain by harnessing the synergy of global research knowledge and
your internal data.
Enable and accelerate complex discovery workflows
Some example use cases include target discovery and optimizing the selection of targets to streamline R&D, or clinical trial scoping and market access support, as well as more technical applications, such as bringing together knowledge graphs and LLMs to drive internal end-user interfaces for knowledge discovery.
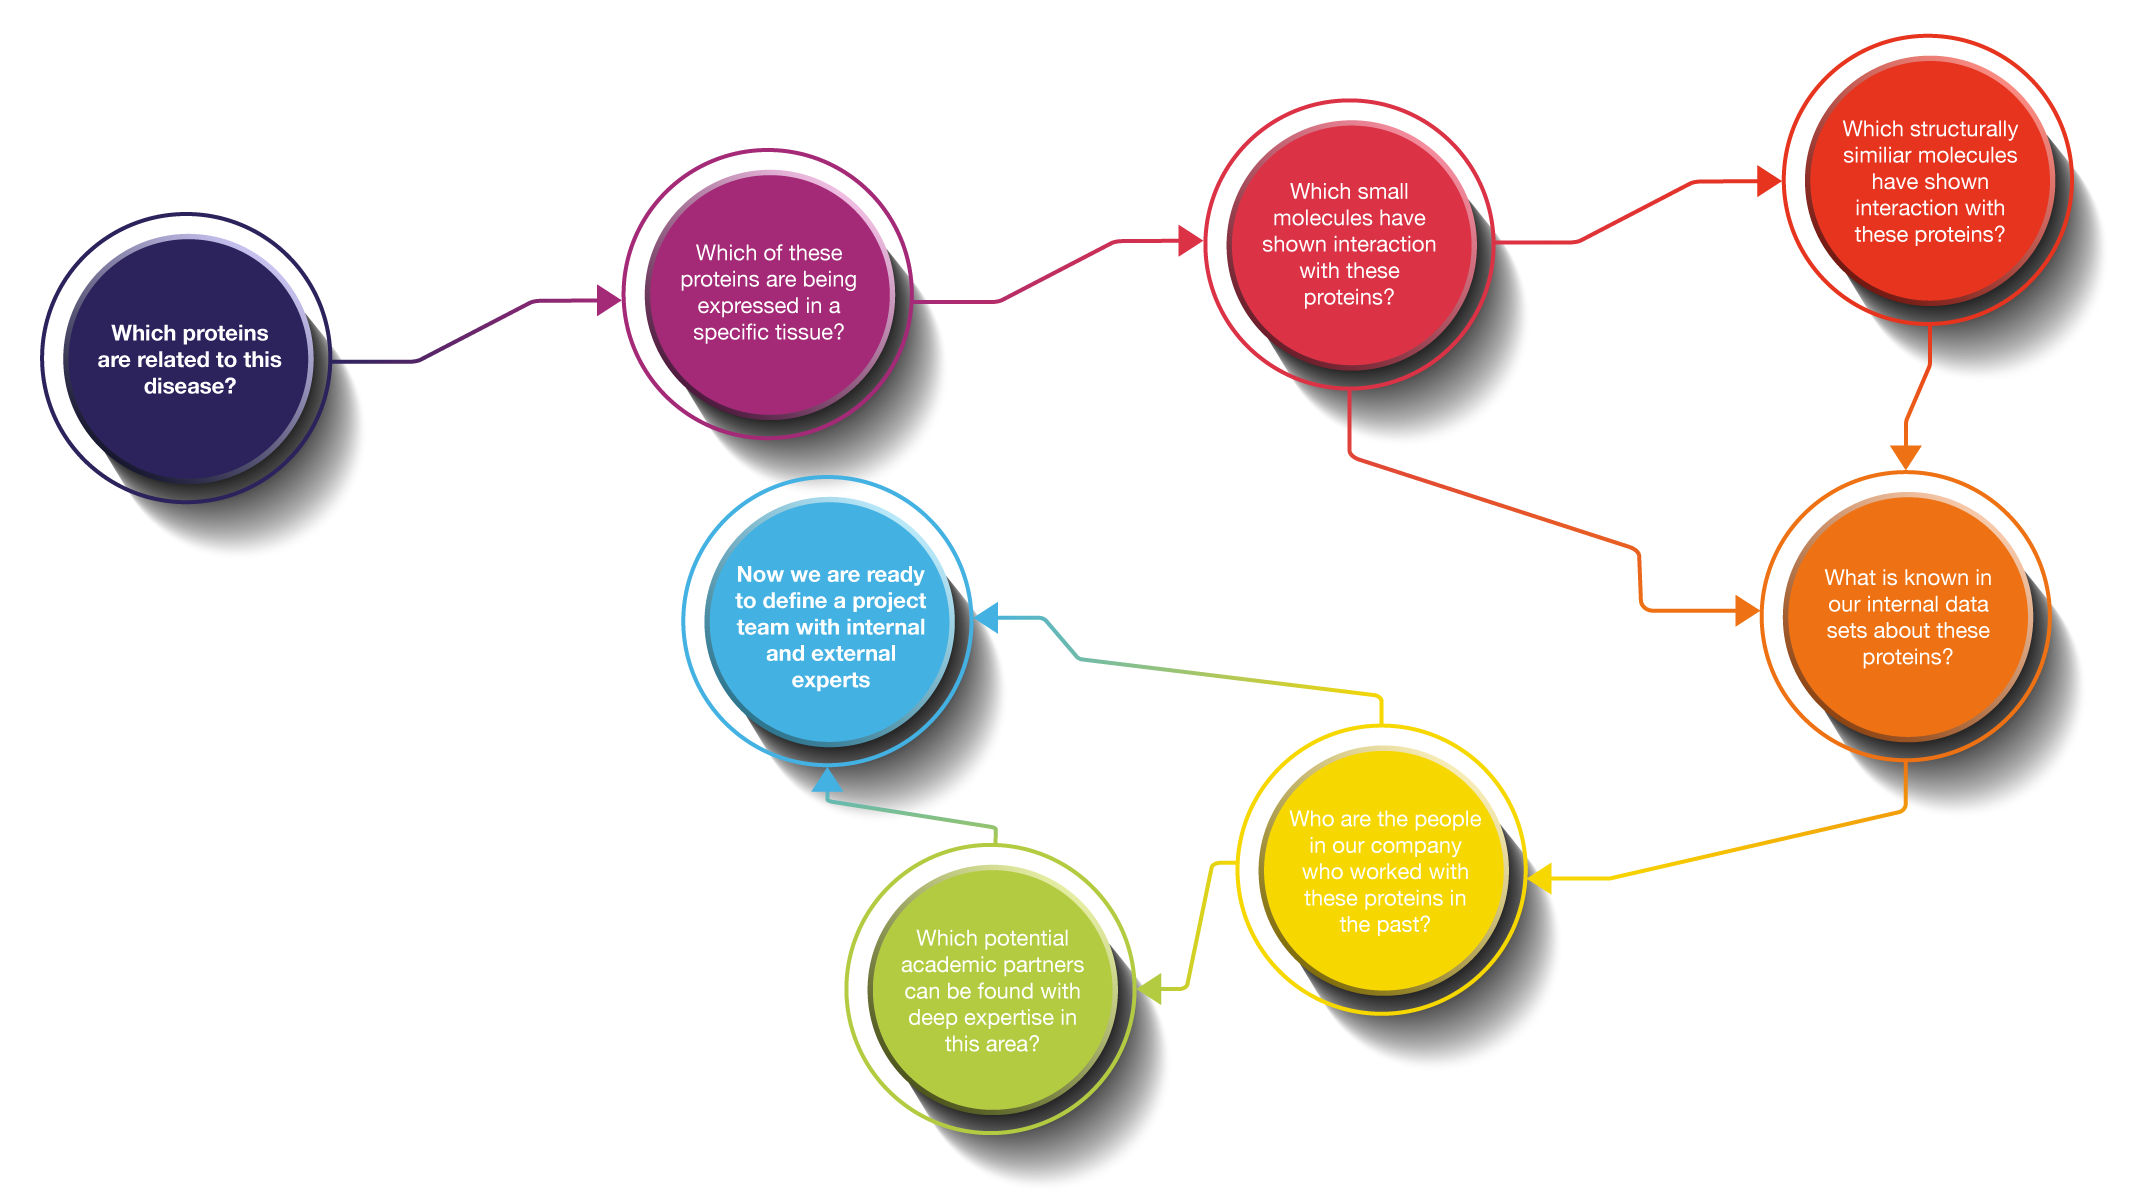
With a complex use case, one may start with an initial question: “Which proteins are related to ‘x’ disease?” Initially, you might focus on identifying targets for specific disease areas and then expand your search to additional data sources, such as examining tissue expressions. To understand small molecule compounds, you will need to identify interactions with proteins and explore structurally similar molecules and specific compounds. If data isn't immediately available, you can seek out additional insights from internal datasets and review what ongoing research exists and the project teams, external experts, or CROs (Contract Research Organizations) that have been involved with the protein. This decision-making process involves traversing across various data sources, departments, and internal/external literature, which the Dimensions Knowledge Graph facilitates.
Enable and accelerate complex discovery workflows
The robust offerings of the Dimensions Knowledge Graph make it an essential solution for any organization working in the pharma and life sciences industries. Powered with expansive, contextualized knowledge, you can fast-track target discovery, streamline processes, speed up drug safety review and reuse existing internal and external knowledge for future use cases, among many other things.
With the Dimensions Knowledge Graph, you get endless knowledge at your fingertips. Imagine the possibilities.
Try it for yourself
If you want to explore the Dimensions Knowledge Graph, you can sign up for the metaphacts Accelerator Package. You’ll gain 3-months of access to the Dimensions Knowledge Graph, individualized support, and training and team enablement. In less than 2 weeks, you could deliver a first MVP using our global research knowledge and your internal data.
Included in the Accelerator Package:
- Access to the Dimensions Knowledge Graph for 3 months
- Expert support during the project duration to help connect with your internal data sources for your use case
- Team enablement and training as part of the metaphacts Academy
About Dimensions
Part of Digital Science, Dimensions is among the world's largest linked research database and data infrastructure provider, re-imagining research discovery with access to grants, publications, clinical trials, patents and policy documents all in one place. www.dimensions.ai. Follow @DSDimensions on Twitter and LinkedIn.
About metaphacts
Part of Digital Science, metaphacts helps global enterprises transform data into consumable, contextual and actionable knowledge. Our low-code, FAIR Data platform metaphactory simplifies capturing and organizing domain expertise in explicit semantic models, extracting insights from data and building knowledge discovery interfaces. www.metaphacts.com. Follow @metaphactsGmbH on Linkedin.