
Large enterprises have identified knowledge graphs as a solid foundation for making data FAIR and unlocking the value of their data assets. Data fabrics built on FAIR data drive digital transformation initiatives that put companies ahead of the competition.
But while the benefits of knowledge graphs have become clear, the road to their implementation has often been long and complex, and success has relied on the involvement of seasoned knowledge graph experts.
This blog post goes through the basics of the joint solution delivered by Ontotext and metaphacts to speed up this journey.
GraphDB & metaphactory Working Hand in Hand
At the heart of our solution are Ontotext's GraphDB and metaphacts' metaphactory.
GraphDB is a leading RDF database that allows diverse data linking, indexing data for semantic search and enriching it via a text analysis plugin to build big knowledge graphs. GraphDB has open-sourced front-end and engine plugins that further empower knowledge graph development.
metaphactory is an innovative FAIR data, knowledge graph platform that supports knowledge graph management, rapid application building and end user oriented interaction. It helps unlock the value of data assets to build flexible, agile solutions that fit specific business needs.
Our joint end-to-end solution enables you to create large, highly interconnected knowledge graphs and expose data to your end users through an intuitive business application. You can learn more about our joint solution from our use case brief, which uses an example from the Life Sciences domain to show you how you can go from an idea to production in just a few weeks.
In this blog post, however, we want to address those readers who have already built a knowledge graph with GraphDB. Here, we'll demonstrate how using the metaphactory knowledge graph platform on top of GraphDB can help them accelerate their knowledge graph journey and generate value from it in a matter of days.
Common Challenges in Knowledge Graph Projects
For all use cases across any verticals Ontotext and metaphacts have been involved in, we've seen again and again that there are common issues our customers struggle with. Very often, once they've invested time into building a knowledge graph - they’ve gone through the process of defining their semantic model, integrating their various data sources into the knowledge graph and mapping them to the model - they encounter questions such as:
- How can we quickly demonstrate the value to end users and business managers?
- How can we ensure we surface all of the capabilities of semantic models and interconnected knowledge graphs to the end user?
- How can we jointly prototype applications utilizing the knowledge graph together with business users?
- How do we build applications that automatically adapt or can be easily adapted to changes in the knowledge graph?
In other words, it seems that moving from the technical integration layer to the next stage of the process is a complex task, which proves to be difficult for many people.
A Model-Driven Approach to Knowledge Graph Applications
The main idea behind metaphactory is to provide the tools you need to quickly and easily build an interface to your knowledge graph.
metaphactory is not just any kind of platform for creating applications but it is tailor-made for knowledge graphs. It builds upon RDF and other W3C Semantic Web standards and allows you to connect to an existing knowledge graph and to visualize it out-of-the-box. What this means is that you will be able to immediately show the semantic model you have created to describe your data, share it in a visual form and allow your end users to interact with the data.
Very often, when domain experts in large organizations access the integrated data using metaphactory’s out-of-the-box search and exploration features, they discover new and often unexpected insights. One customer, for example, discovered that they are running a number of parallel research projects on the same topic with no connection between the involved teams and therefore very likely duplicated efforts.
As they start to explore the data, users begin to see - for the first time - connections between data points living in different systems. And this is where the value of the knowledge graph comes to the fore - the ability to explore it, to analyze it, to use it.
GraphDB and metaphactory: The Basics
After metaphactory has been deployed on top of your knowledge graph and you've had some time to interact with the data and see what's possible in terms of out-of-the-box exploration, we work together with you to address your specific business needs. Here it is important to mention that while we are happy to collaborate with you on this process, metaphactory allows you to complete all of the steps described below on your own, i.e., without the need of additional consulting.

You can work on the underlying knowledge graph model to validate that you have all suitable data sources, that the right level of integration is established and that your domain's specific concepts and relationships are accurate. The great thing about metaphactory’s visual ontology editor is that it supports a collaborative knowledge modeling process and allows both domain experts and end users to contribute, provide feedback and validate the model, without any knowledge of the semantic technology stack. And this is a very flexible process, so whenever necessary, it's easy to go back and make changes to it.
If you want to enhance the value of your proprietary data (including relational databases, textual data, etc.), we can also help you integrate additional data and map it to your model. We can provide access to Ontotext's inventory of more than 200 preloaded public datasets and ontologies in the Pharma and Life Science domain. They are in RDF format and cover various areas of expertise such as genomics, proteomics, metabolomics, molecular interactions and biological processes, pharmacology, clinical, medical and scientific publications. If then you find that, based on the additional data, something else needs to be changed in the model, we go back again and we do it using metaphactory’s visual ontology editor.
Finally, depending on what you want to enable your end users to do and how you want them to browse and interact with your data, you can use metaphactory to translate these needs into UI components. metaphactory has a vast library of components (including search interfaces and filters, drill-down interfaces, discovery and exploration interfaces, data curation interfaces, etc.), which can be quickly used to define your user experience. The resulting UI can be reviewed with your business unit and easily changed if needed.
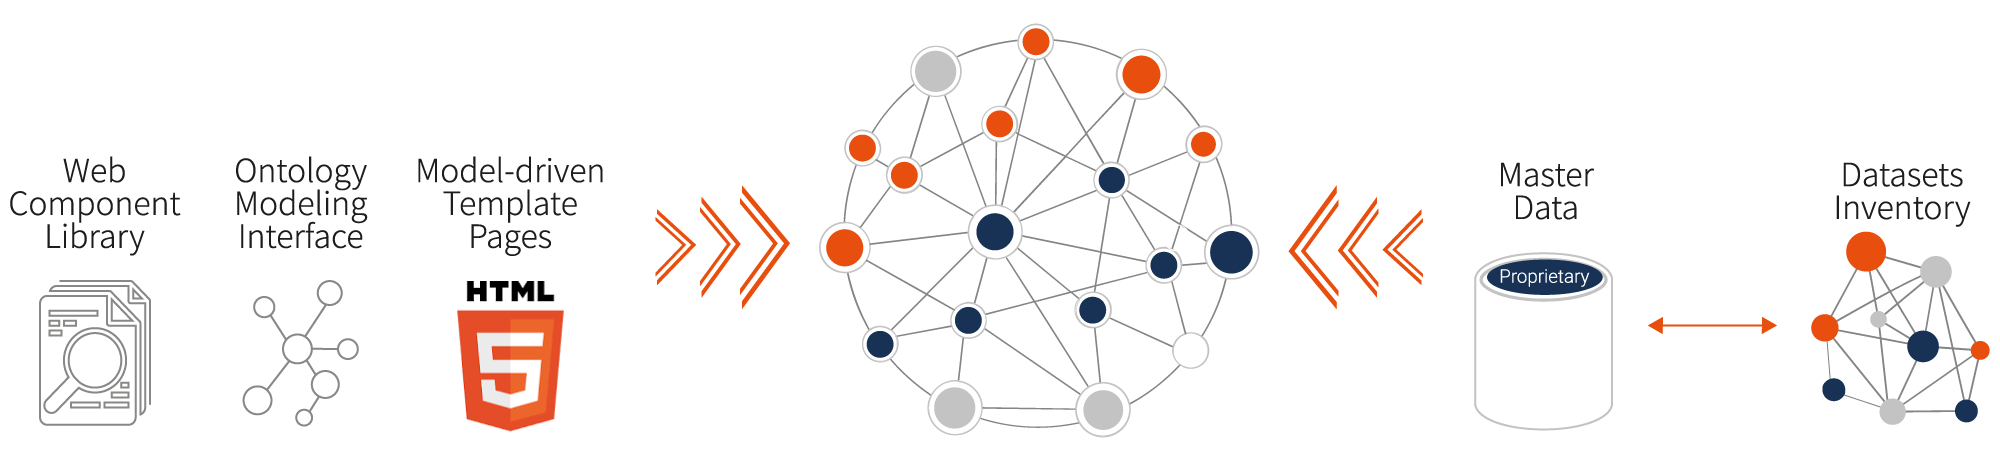
You can repeat this process as often as necessary to bring in new ideas and feedback from your end users, connect additional data sources with GraphDB, refine your semantic model, polish the UI, etc. We typically do that in two-week iterations, which means that, after the first two weeks, you already have a system you can demonstrate to your end users.
To enable such a quick, iterative process, we use a data and model-driven approach. metaphactory utilizes the structure of your knowledge graph and the definitions in your semantic model to drive the UI. This enables you to deliver quick results and enhance the user experience step-by-step.
Use Cases
On top of such a knowledge graph, we can develop various use cases. Below is a list of some use cases we're currently working on in the Life Sciences domain:
- Use case: Identifying key experts in a therapeutic area and/or geographic region.
Example Question: "Show me all clinical researchers participating in clinical studies for a specific condition."
Result: A list of all researchers and their affiliations, who had managed clinical study research for a specific condition/therapeutic area for a specific geographic region and period as well as a map showing interesting clusters. - Use case: Matching patient profiles towards clinical study inclusion/exclusion criteria.
Example Question: "Show me patients that satisfy both inclusion and exclusion criteria for a study."
Result: A comprehensive list of patient profiles matching the study criteria as well as a chart showing age distribution for these patients. - Use case: Improving disease understanding by leveraging existing data to explore relations between proteins, diseases and drugs.
Example Question: "Show me all interactions between proteins targeted by certain drugs in a tissue of choice."
Result: A comprehensive overview of proteins that can be linked to the disease at hand through their interaction with other proteins. - Use case: Developing new drug therapies by looking at protein-protein interaction partners of genes.
Example Question: "Show me kinase interaction partners for a certain gene."
Result: Dashboard listing kinase interaction partners, the drugs they can be targeted with, as well as other related details such as side effects or dosage.
If you want to learn more, you can also listen to our on-demand webinar on the same topic »
Why Not Build My Own Application From Scratch?
Some customers have been tempted to build their applications in-house with their own or an outsourced software development team.
This is, of course, a valid option. However, building an application on top of a graph takes time (usually three to six months) and requires sufficient knowledge of the semantic technology stack. Instead of empowering your end users to access and interact with the data or collecting their feedback, you'll be spending a lot of time on things that don't bring immediate value. Your hands will be tied to building user authentication and authorization, an abstraction layer to the underlying graph database, the integration with various graph database specific features, APIs, federation, etc. On top of that, once you have created your model and have the system in production, it may be difficult to make changes to it that reflect your users' feedback.
The joint solution provided by Ontotext and metaphacts builds on vendor-supplied enterprise products and covers all of these aspects. It includes an RDF database that offers highly interlinked information across various data sources and a platform with model-driven components that allows you to quickly build on your knowledge graph. With GraphDB and metaphactory working together, you can quickly show the value of your knowledge graph and have all the infrastructure you need when your graph is ready for prime time.
To Sum It Up
The joint solution provided by Ontotext and metaphacts can help you create your domain-specific knowledge graph and quickly utilize it. Or, if you already have one, we can help you accelerate your knowledge graph journey and generate value from it in days.
Using metaphactory, you can easily validate and further refine your semantic model. You can integrate your own data sources and add the curated datasets and ontologies available with GraphDB. Finally, you can use metaphactory's low-code building blocks to create an intuitive user experience for your end users and meet their specific business needs.
When GraphDB and metaphactory work hand in hand, this enables you to get a cross-functional, human and machine- understandable Data Fabric. Then you don't need to worry about what to do with the knowledge graph you have built. Instead, you can quickly start using it to provide an integrated view of all your data and allow your end users to consume this data and extract actionable insights from it.
Stay tuned for the second part of this post where we'll look at specific examples and demonstrate how GraphDB and metaphactory work together!
That's cool, where can I learn more?
Don't hesitate to reach out if you want to learn more about our joint solution based on GraphDB and metaphactory and make sure to also subscribe to our newsletter or use the RSS feed to stay tuned to further developments at metaphacts.