In our previous post, we covered the basics of how the Ontotext and metaphacts joint solution based on GraphDB and metaphactory helps customers accelerate their knowledge graph journey and generate value from it in a matter of days.
This post looks at a specific clinical trial scoping example, powered by a knowledge graph that we have built for the EU funded project FROCKG, where both Ontotext and metaphacts are partners. It demonstrates how GraphDB and metaphactory work together and how you can employ the platform's intuitive and out-of-the-box search, visualization and authoring components to empower end users to consume data from your knowledge graph.
You can also listen to our on-demand webinar on the same topic or check out our use case brief.
The Background Story
Clinical research has always been a hot topic in Pharma, Healthcare and other related domains. However, in the last couple of years, and especially with the COVID-19 pandemic, user groups outside these specialized domains have become interested in it. Today, users from the general public, journalists, etc. often want to find information about a particular medical product, for example, if any serious adverse reactions have been reported for it.
FROCKG (Fact Checking for Large Enterprise Knowledge Graphs) is a Eurostars-2 project that aims to develop efficient approaches to ensure the veracity of facts contained in enterprise knowledge graphs. As part of the project, Ontotext and metaphacts have integrated core biomedical ontologies into the FROCKG knowledge graph, providing a referential baseline for normalizing different types of information scattered in domain-rich datasets such as ClinicalTrials.gov, DrugCentral, FDA and many others.
The resulting knowledge graph contains close to 1 billion facts representing the available public drug-related clinical knowledge. It supports the FROCKG project consortium in evaluating the new functionality developed as part of the project on enterprise, real-world data. It also helps iterate over the use cases described in the project proposal and refine them to achieve feasible solutions for commercialization.
LinkedLifeData Inventory Pre-loaded In GraphDB
As we already mentioned in our previous post, our joint solution provides access to Ontotext's Life Sciences and Healthcare Data Inventory of more than 200+ preloaded public datasets and ontologies in RDF format about genomics, proteomics, metabolomics, molecular interactions and biological processes, pharmacology, clinical, medical, scientific publications and many more.

Using ontologies such as SNOMED, UMLS and Wikidata allows you to identify concepts within this rich domain of public datasets. However, although some ontologies or domain models are available in RDF/OWL, many of the original datasets that we have integrated into Ontotext’s Life Sciences and Healthcare Data Inventory are not. The majority of data there is frequently in semi-structured or even free-text format and to understand what a document is about, you have to read the text. Additionally the level of standardization, integration and normalization in these datasets is of varying quality. This might be sufficient for information retrieval purposes and simple fact-checking, but if you want to get deeper insights, you need to have normalized data that allows analytics or machine interaction with it.
Although there are already established reference datasets in some domains (e.g., UniProt for proteomics, ENSEMBL for genomics, ChEMBL for bioactive chemicals, etc) still the semantic harmonization of the data into a knowledge graph remains a significant challenge.
Data normalization is an essential step in the data preparation process. It ensures the semantic harmonization of the data, normalizing property values to corresponding ontology and terminology instances specific to the domain. The strict methodology we have developed identifies similar entities across datasets, establishes linkages between datasets or identifies concepts hidden in unstructured text. For datasets serialized in RDF by their official publishers, we generate additional semantic mappings between certain concepts from referential datasets.
In this way, we consolidate extensive data scattered in domain research datasets, extract the information from it and provide it in a highly harmonized, very well interlinked knowledge graph. This allows us to explore all this information and make analysis comparisons among different entities. As a result, we can find interesting paths and surprising relations between very distant objects, which might not have direct ties.
Semantic Data Integration With GraphDB
In the context of the FROCKG project, we have loaded close to one billion triples in the knowledge graph and, if you want to explore it, you can easily write a SPARQL query that can create a sub-graph.
To enable such analytics and interlinking of use cases, we have used advanced NLP pipelines and have normalized this information to concepts from the FROCKG knowledge graph. For example, the clinical trial record highlighted in the screenshot below tackles the medical condition "Malaria, Falciparum". As a result of the normalization process, you can link this textual information about the medical condition to the medical condition concept in the knowledge graph; this will contain all the information about the "Malaria, Falciparum" condition and all its different types of relations or additional information available in the sources.
The same applies for other entities in the graph such as drugs, for example.
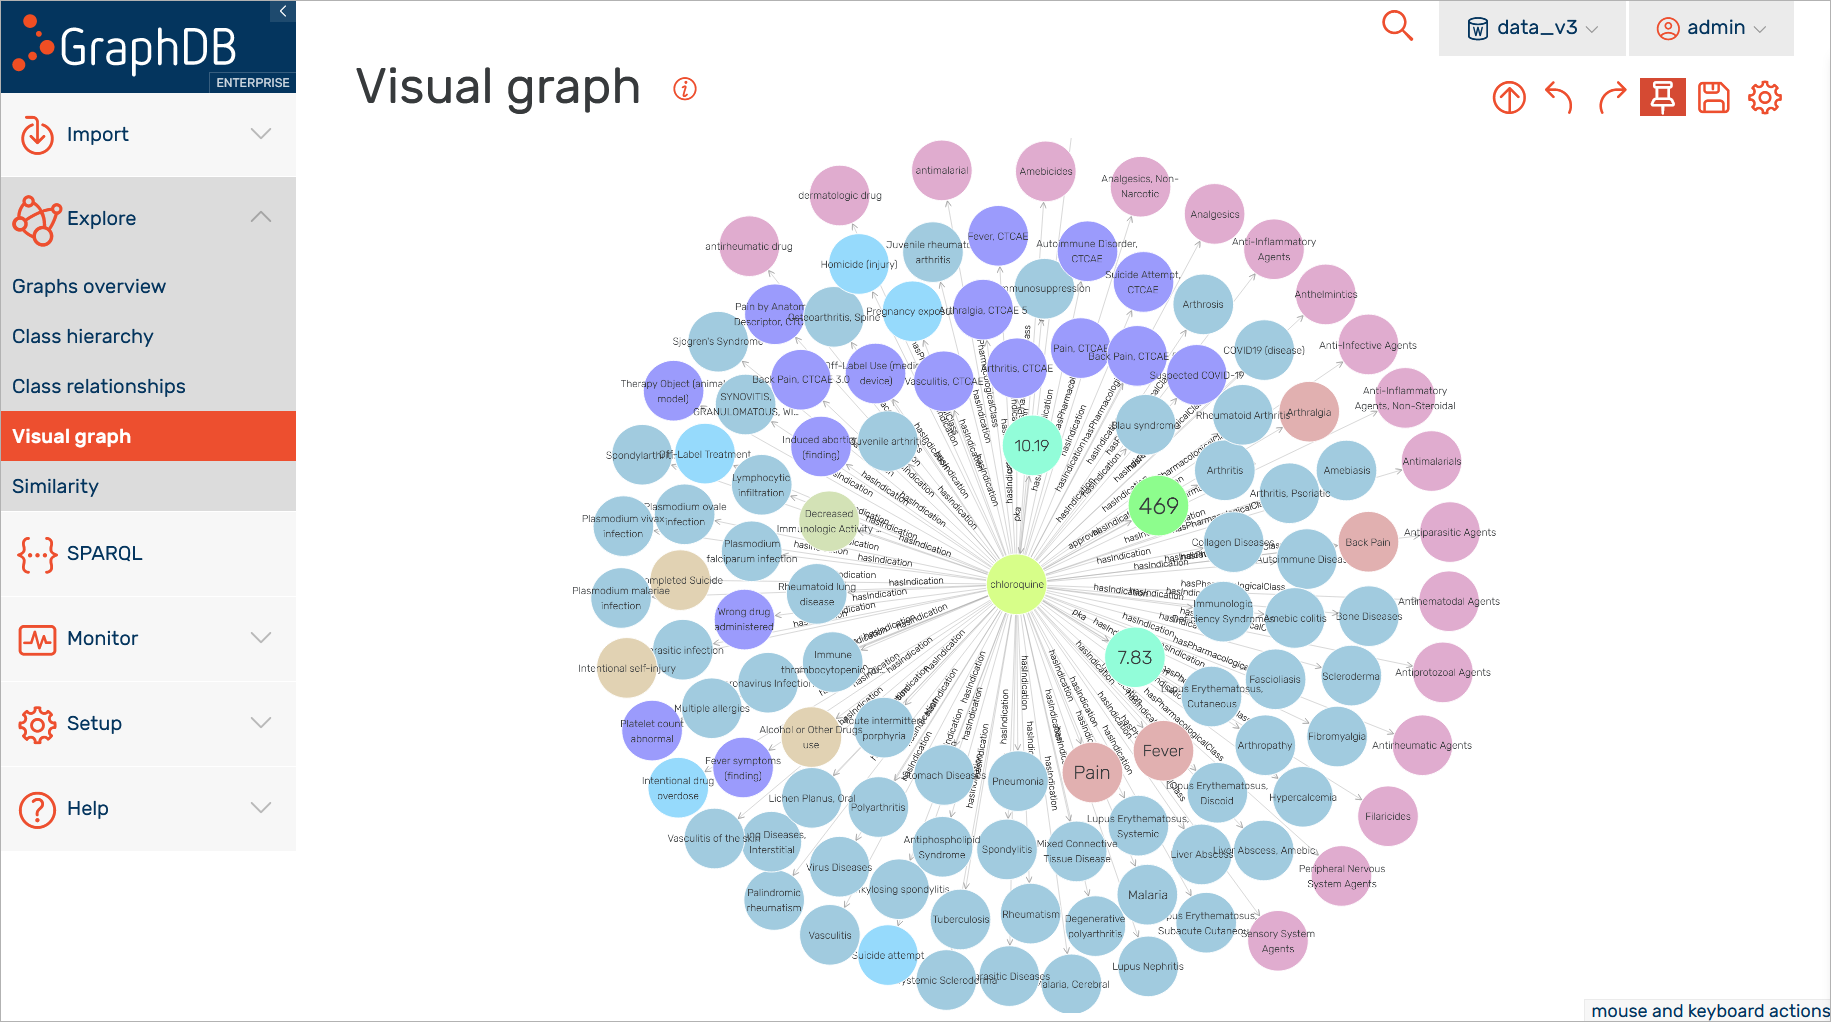
As you can see in the screenshot below, there are many different classifications of the particular drugs for anti-inflammatory and anti-infective agents. There is also a set of different conditions or complications related to specific conditions where a particular drug is used.
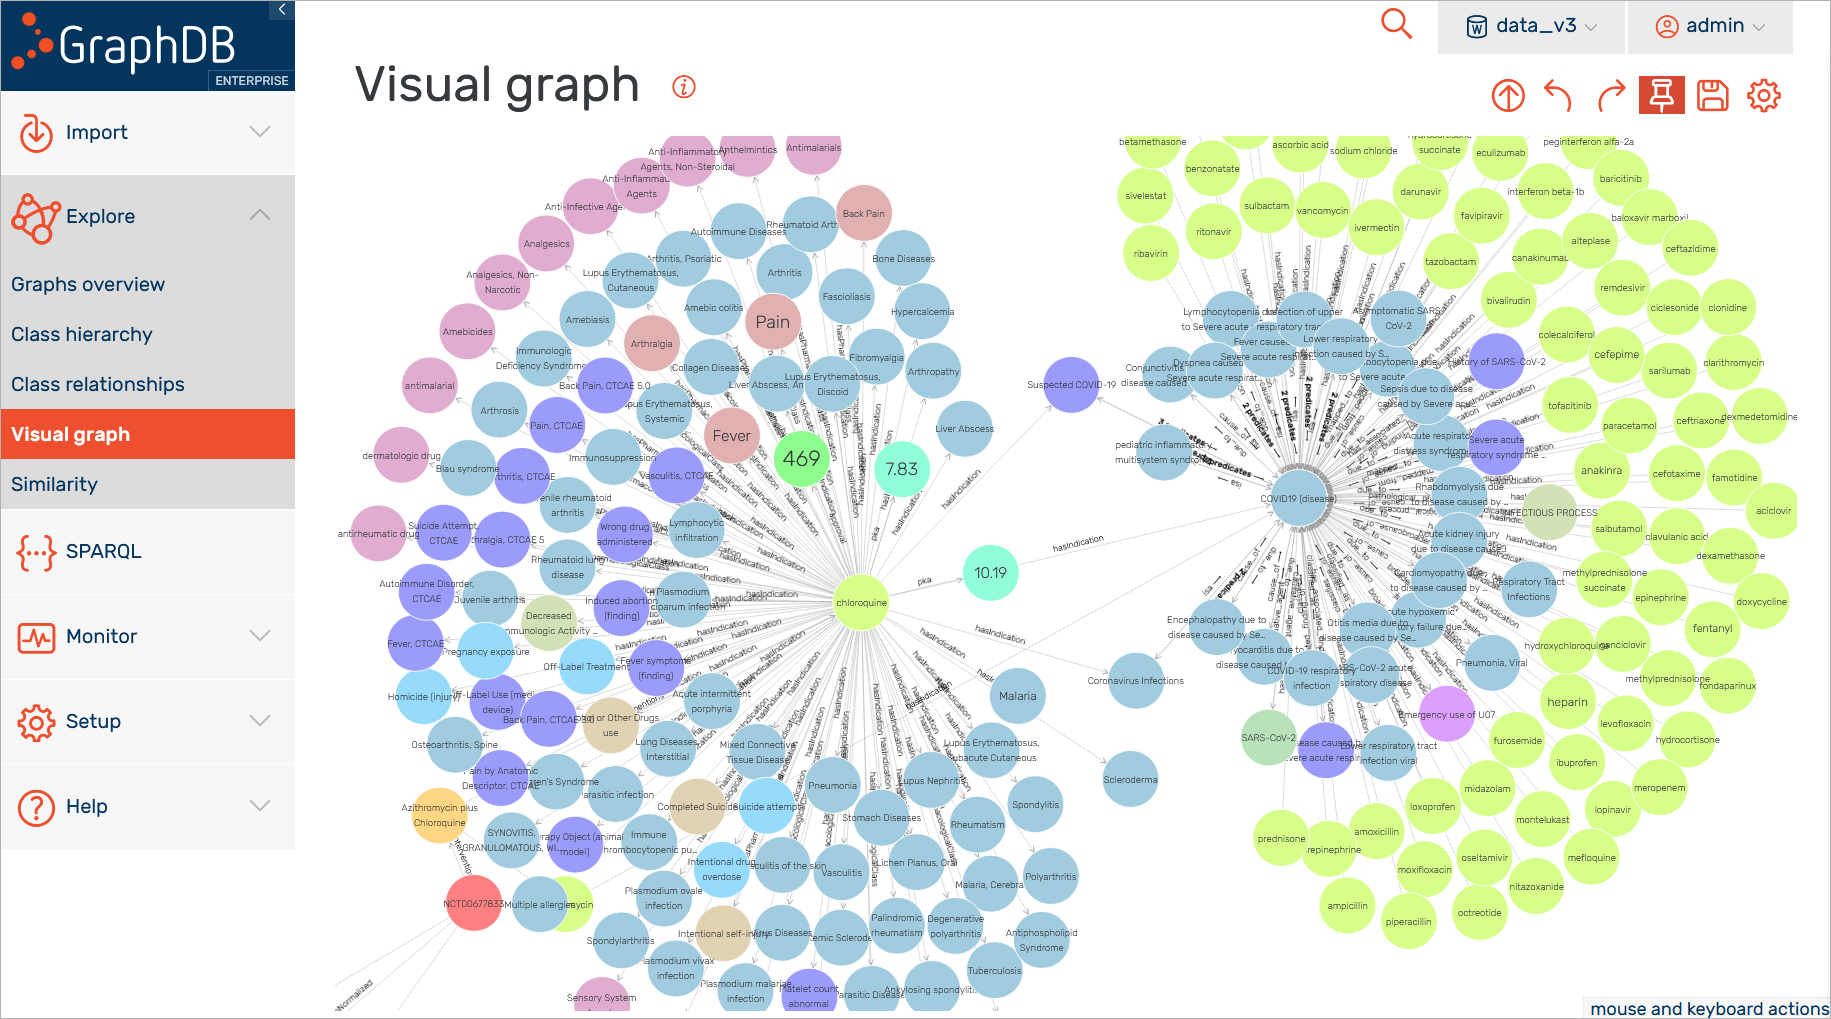
The knowledge graph aims to provide a comprehensive overview of the available information and all the different relations between the concepts so, at some point, the graph can become quite difficult to explore (see the screenshot below). For that purpose, you would require a different tooling and this is where the metaphactory platform comes into play with its intuitive approach for data exploration.
Visual Ontology Modeling With metaphactory
In the context of the FROCKG project, we have connected metaphactory to this knowledge graph created with and hosted in GraphDB.
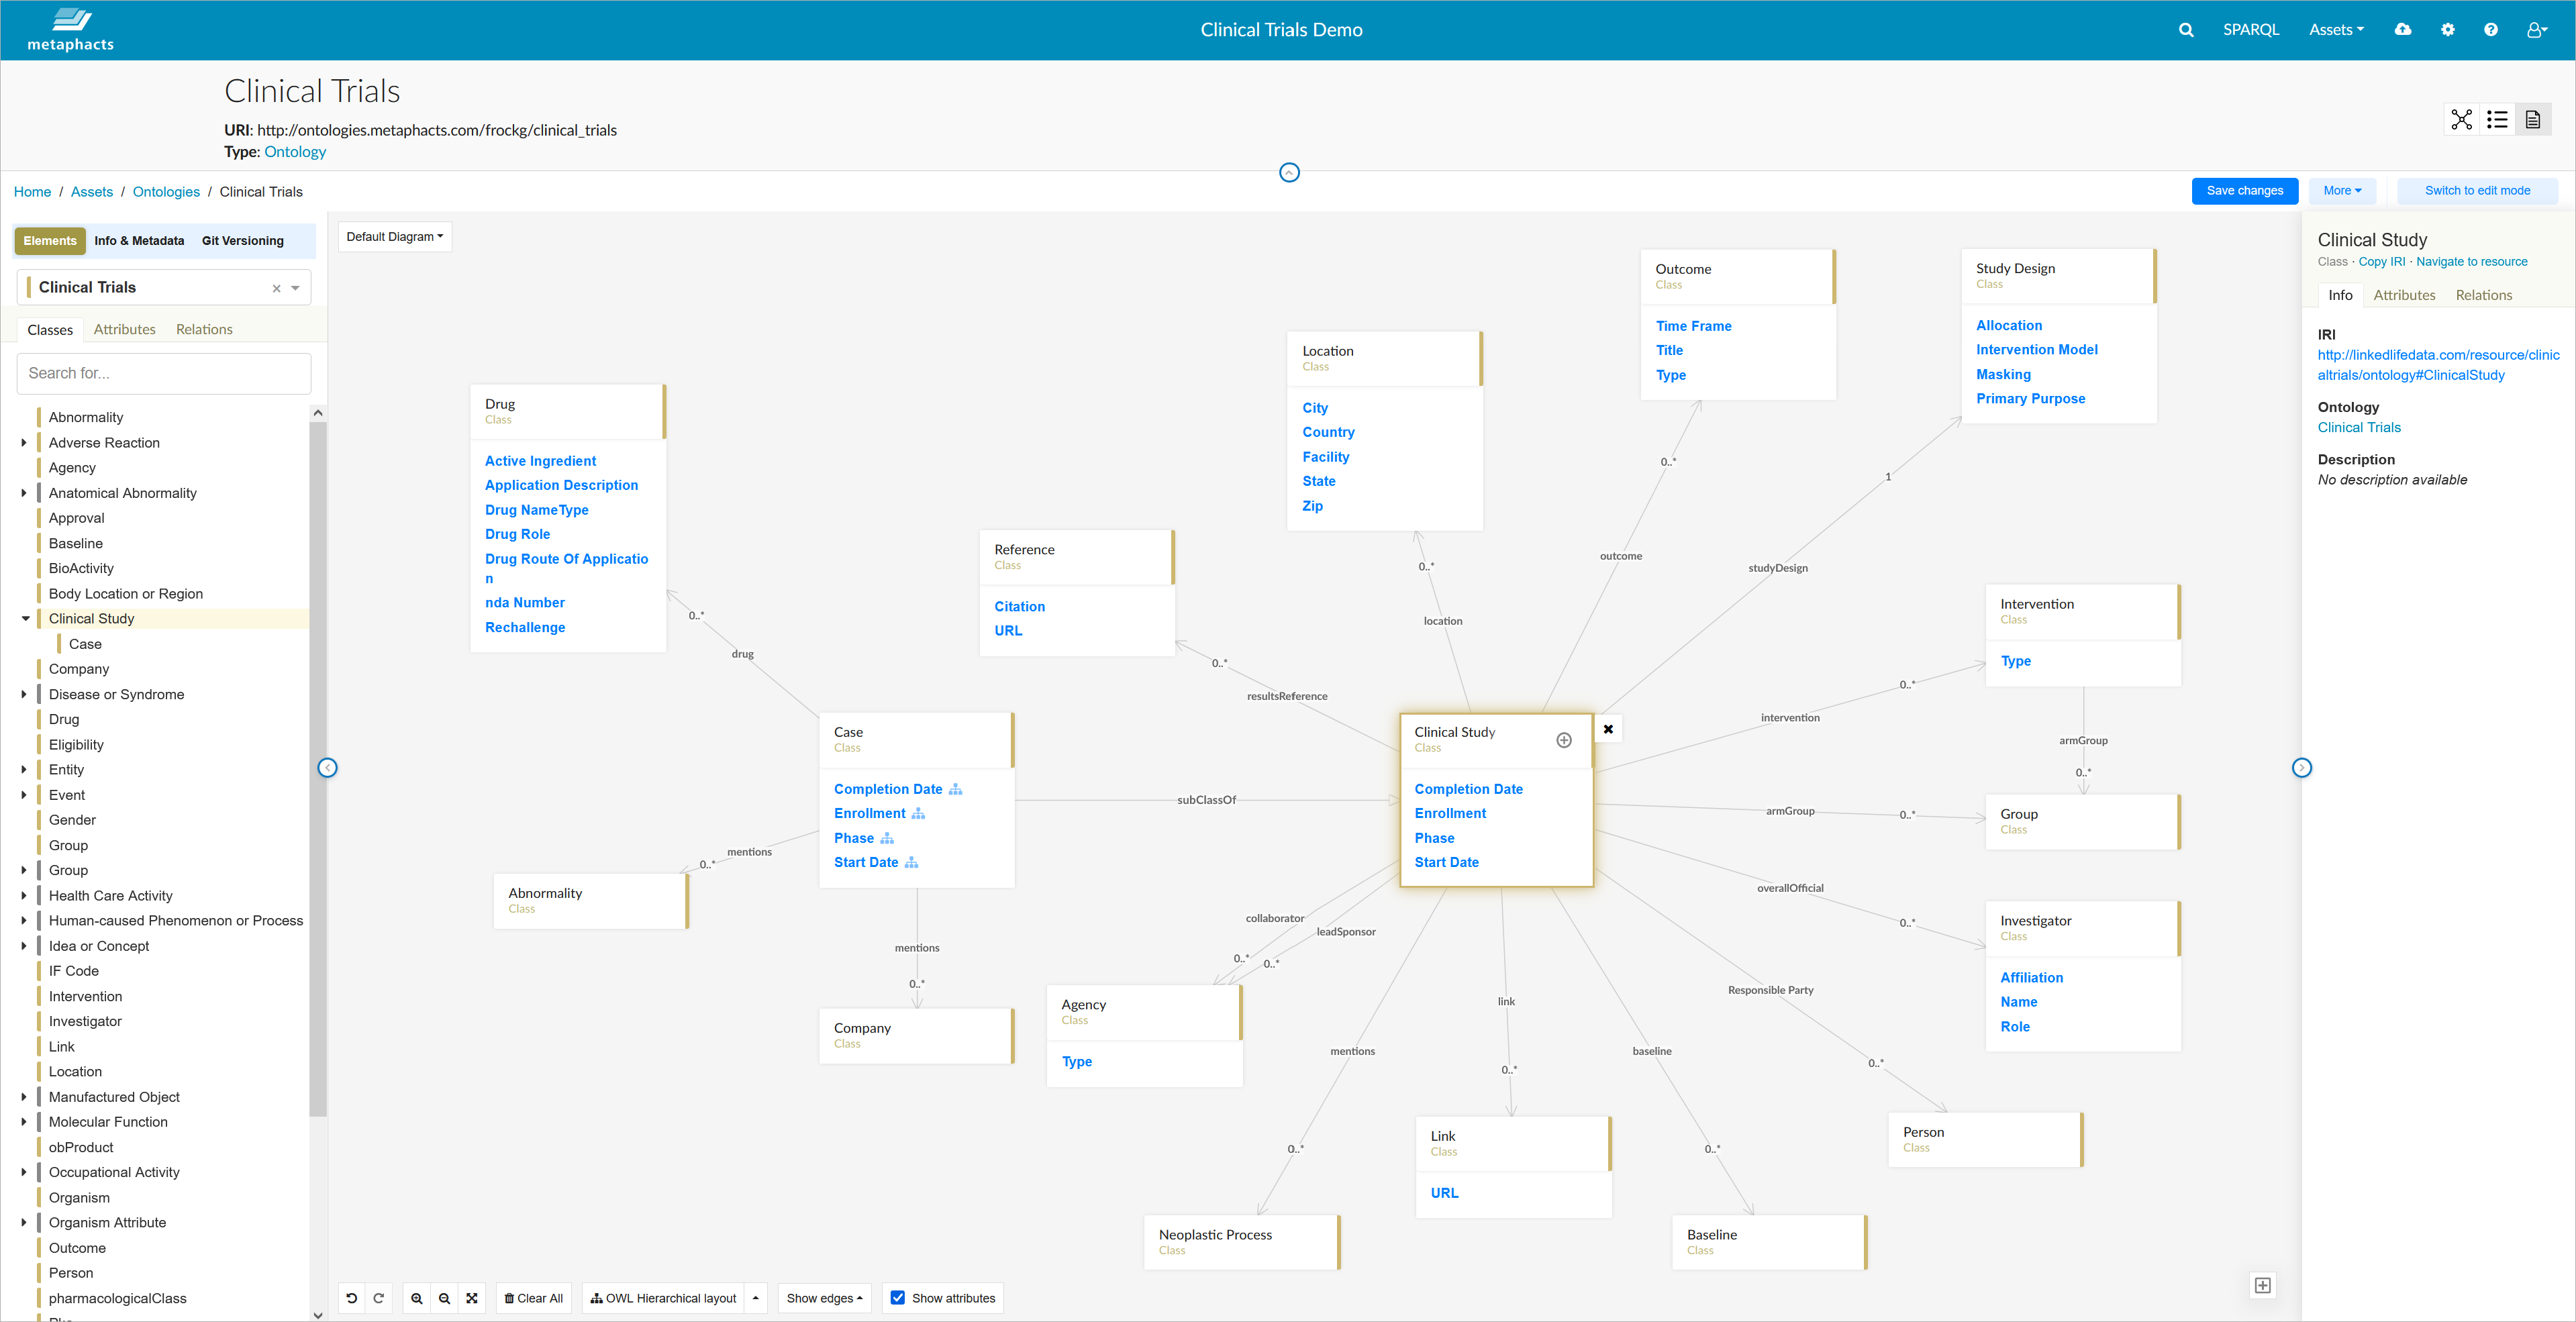
Let's first have a look at the knowledge graph management capabilities provided by metaphactory. The screenshot below shows the clinical trials ontology used for this project. In this case, this is just a subset of the modular ontology that models the clinical trial scoping data.
As we'll be looking at the clinical studies connected to specific locations and specific researchers (or investigators), we'll need to consider concepts such as "Clinical Study", "Investigator", "Location", "Outcome", "Study Design", etc.
You can modify this ontology with metaphactory's visual ontology editor as shown in the screenshot below. It uses the OWL ontology language and SHACL shapes for modeling and defining relations and constraints. The evaluation of SHACL rules is done in the underlying graph database using the integrated GraphDB SHACL Engine. Once you click "Save", the changes are stored and maintained in GraphDB in a consistent way.
Now you can take this ontology and share it with other users for validation or to collaboratively extend it further. One - maybe minor but important - aspect is that the diagram of the ontology will keep its shape, which means that all nodes will be displayed at the exact same place for all users. This makes it much easier to collaborate and discuss specific parts of the model.
Knowledge Graph Visualization and Exploration with metaphactory
Now let's have a look at how you can interact with this dataset.
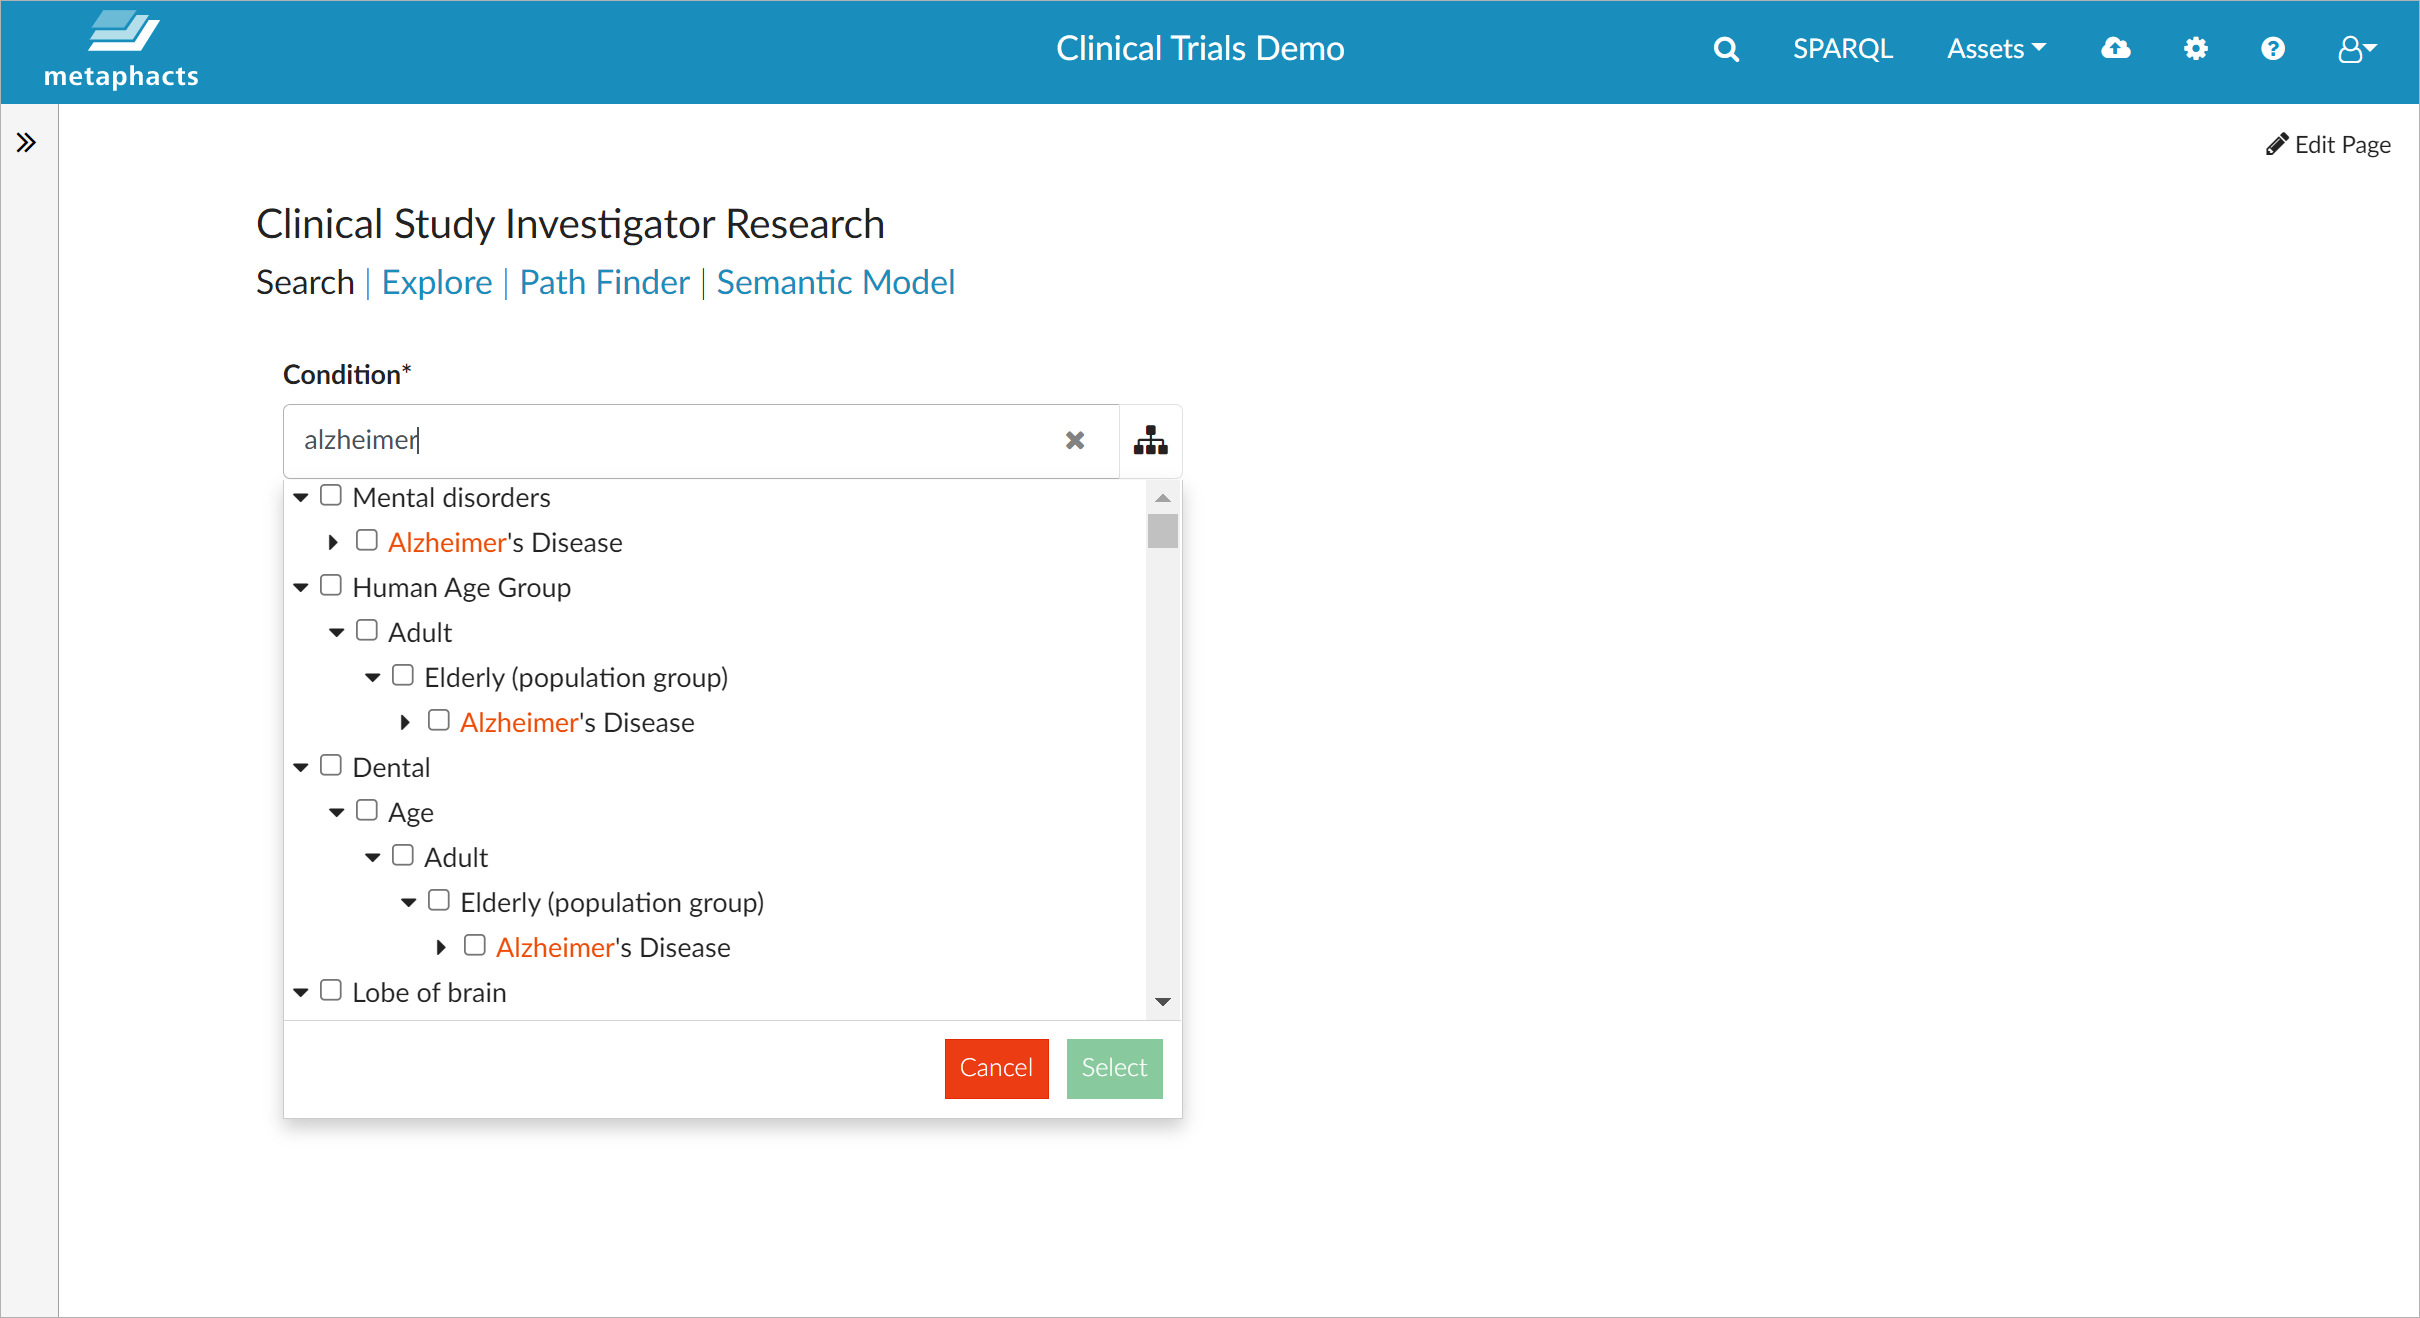
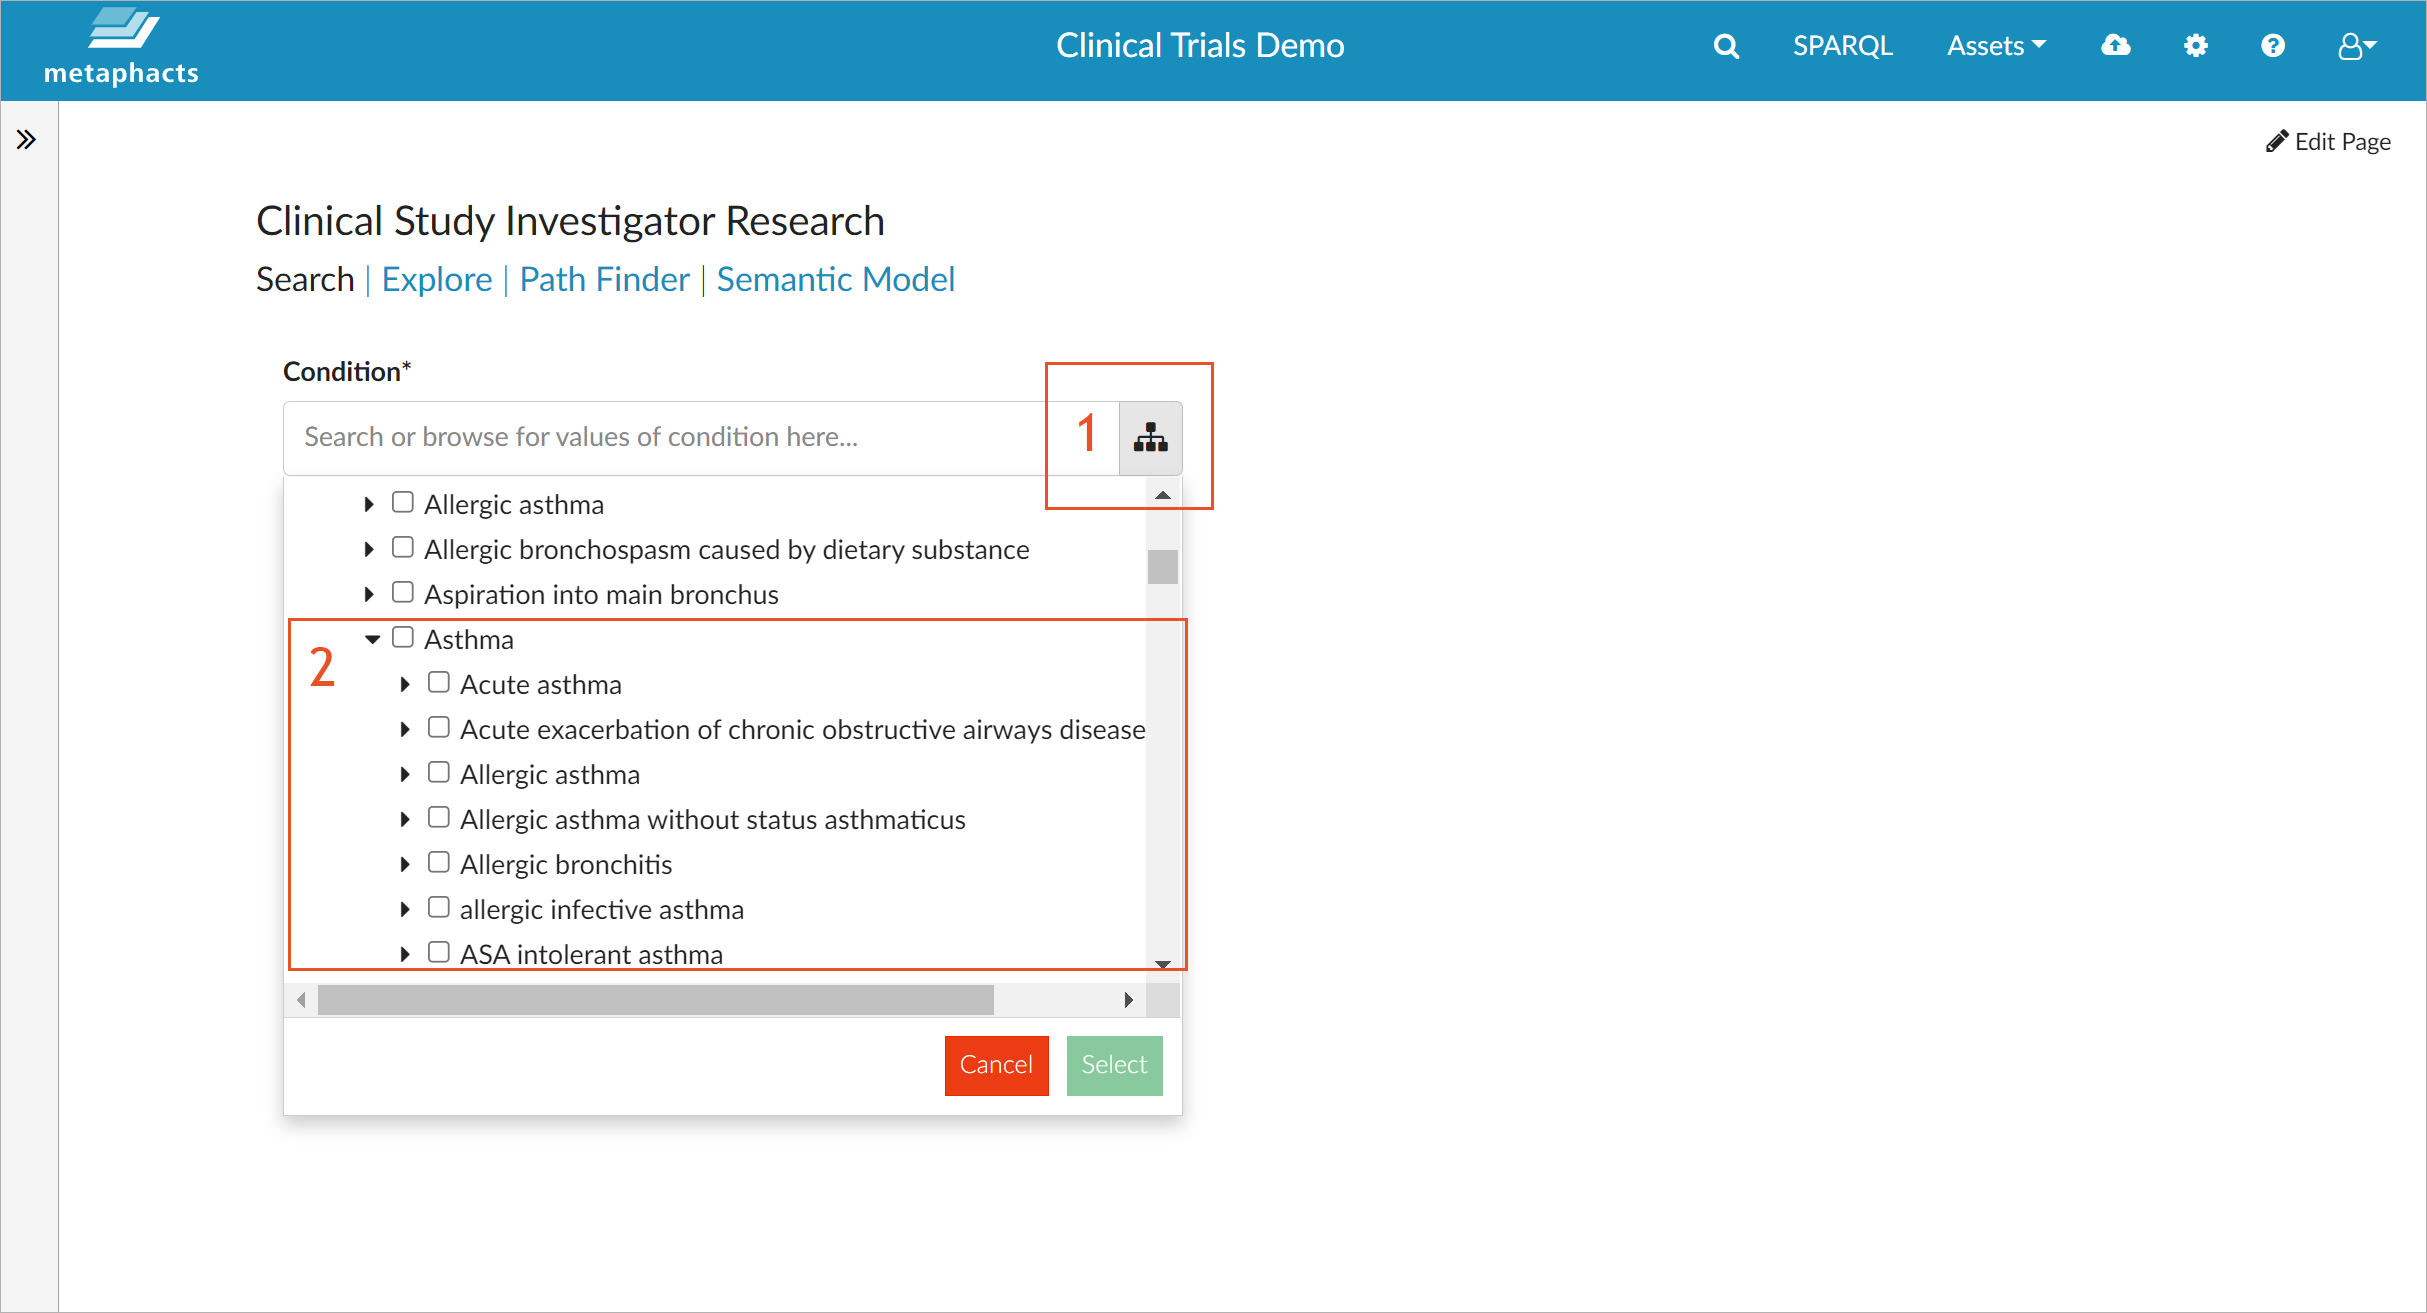
The metaphactory low-code platform is utilized in the context of the FROCKG project to provide a dashboard for finding clinical study investigators based on their research field. Knowledge discovery is one of the core strengths of metaphactory as it enables the creation of UIs that provide a user specific and tailored view on the knowledge graph. For example, if you search for "Alzheimer", you can use the loaded tree of diseases to specify the field for which you want to understand the clinical study landscape and get a listing of all associated studies and their investigators.
The screenshot above shows how metaphactory matches the typed keyword with various levels of the controlled vocabulary of diseases (based on UMLS), so you can select the exact subsection you are interested in.
You can also use the tree to explore the diseases from the top down, i.e., to look at the different therapeutic areas and how various diseases tie into them. For example, if you expand the subtree "Asthma", you can see the different types of asthma described in the knowledge graph.
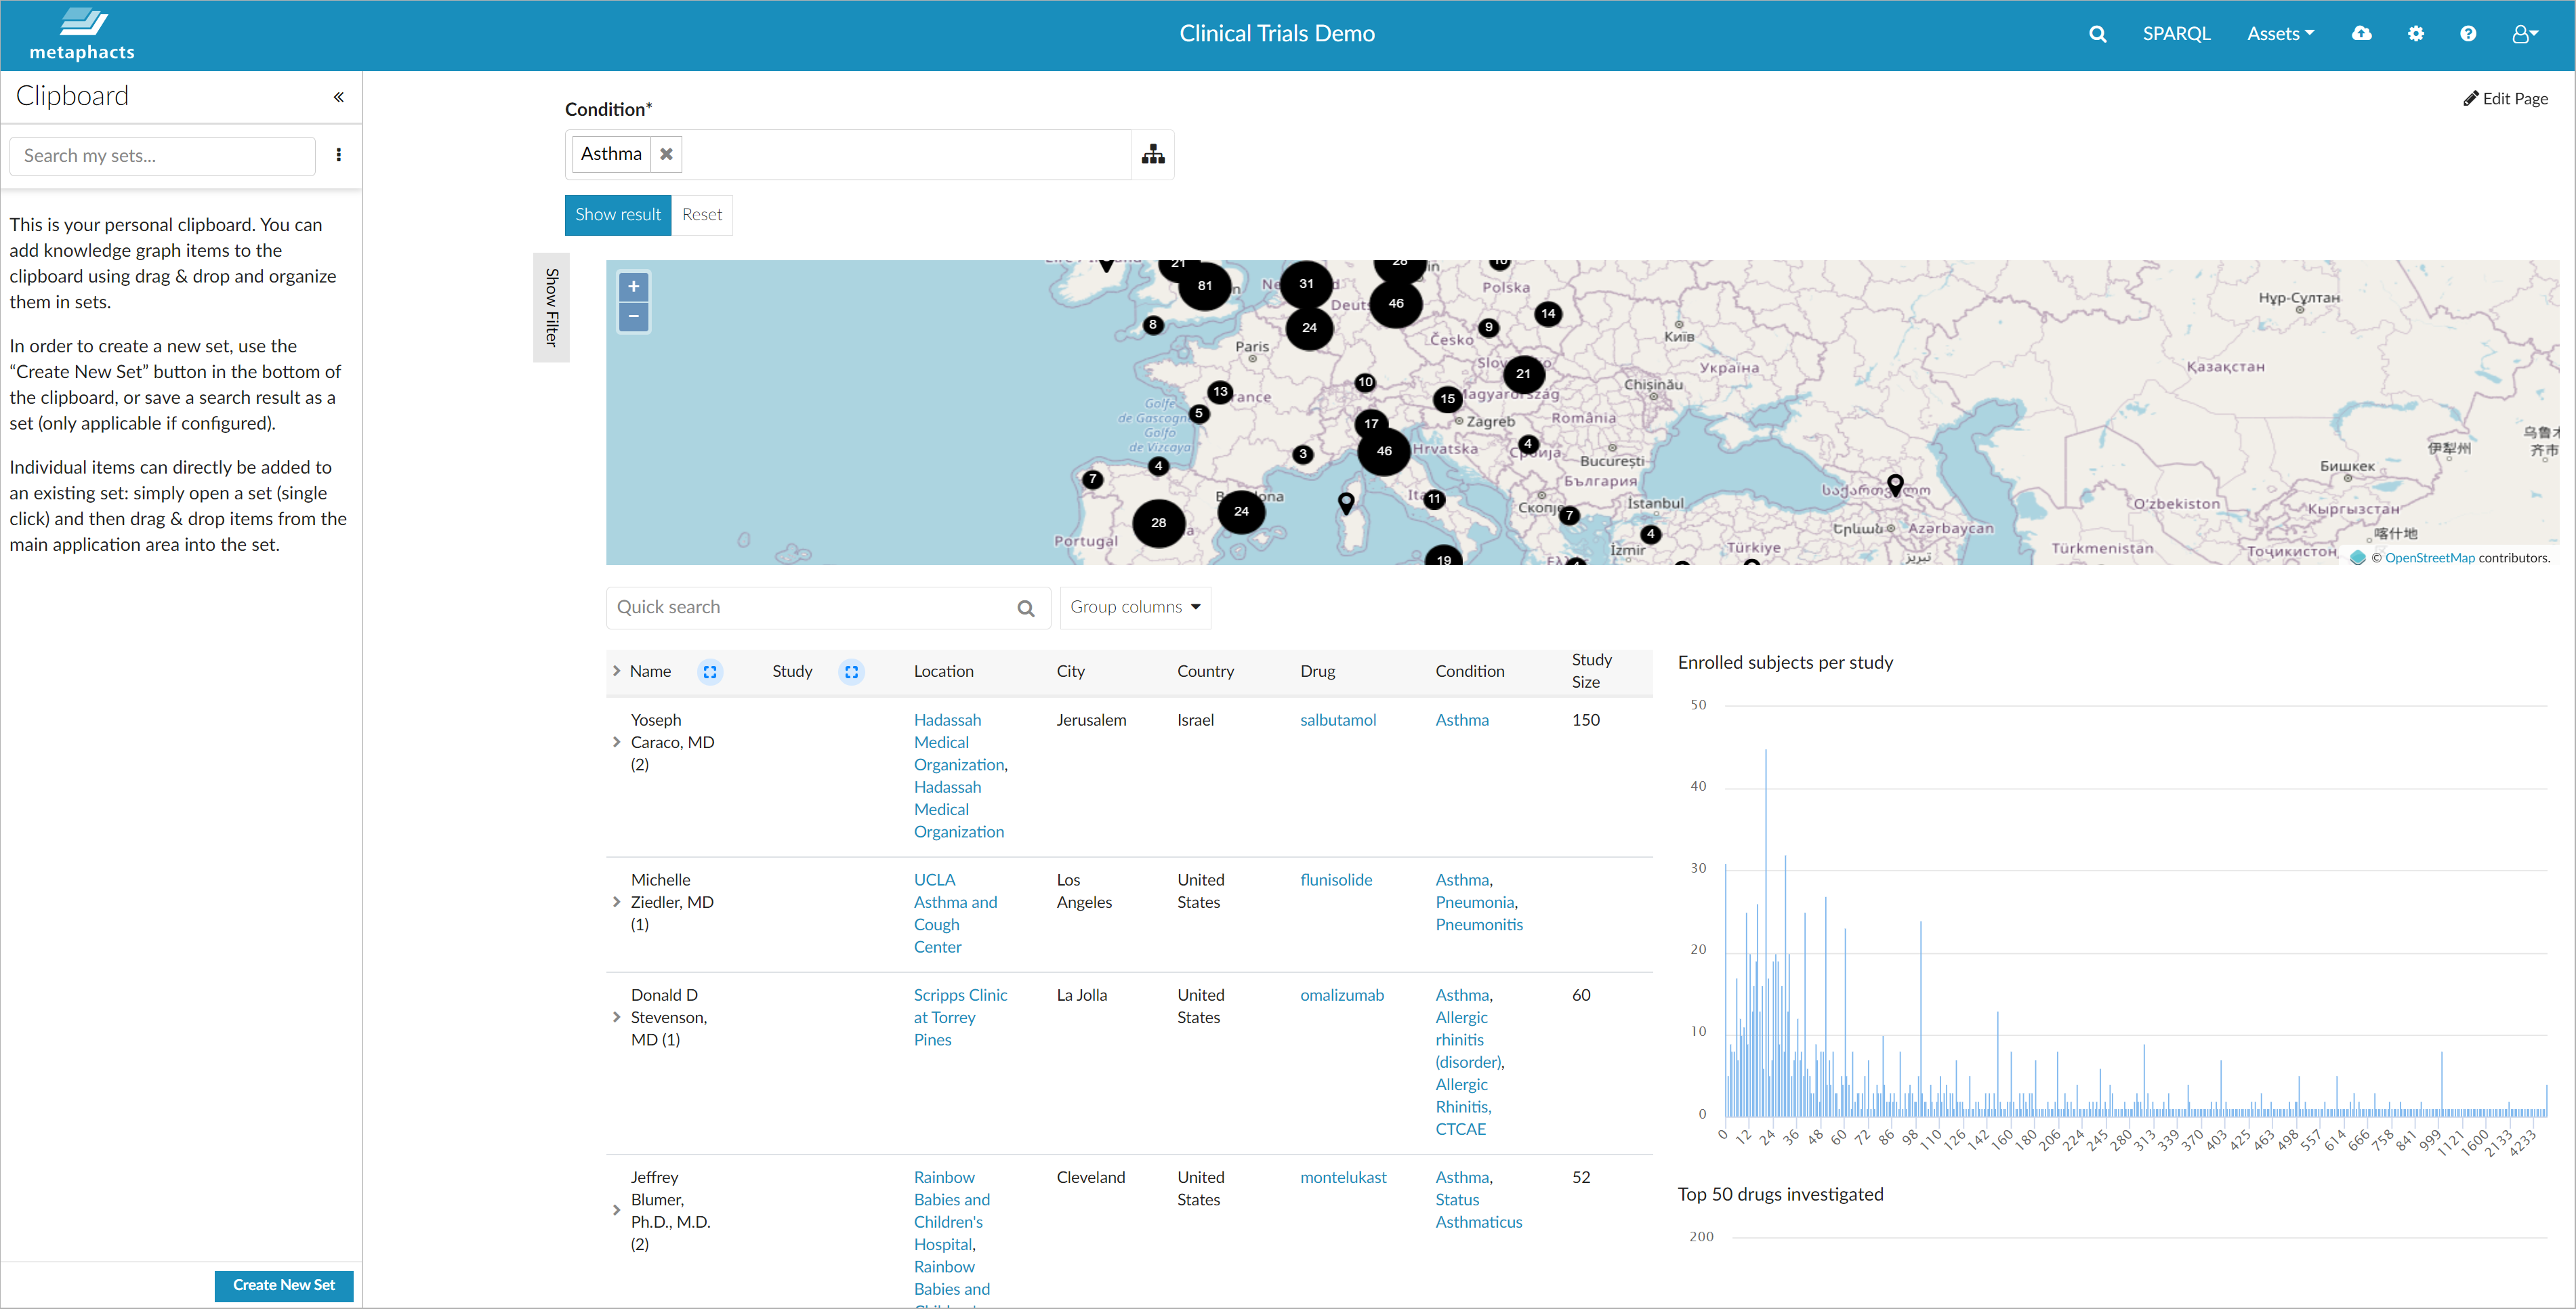
By selecting the entire therapeutic area for "Asthma", you get an overview of all clinical trials available in the database for asthma and all of its subtypes. The displayed information is retrieved by traversing the connections in the knowledge graph and therefore includes details like the drugs involved, relations between these and similar drugs, the investigators who performed the studies, their institutions or organizations and their locations. The interconnected nature of the knowledge graph allows a flexible reporting and visualization of data directly in metaphactory.
The displayed results feature various visualization elements, which can be chosen based on the available data. In our example, we have included (amongst many more):
- an interactive table enabling you to expand the information nodes;
- several charts highlighting essential information such as the top 50 drugs investigated;
- a map allowing you to identify clusters where many studies were conducted.
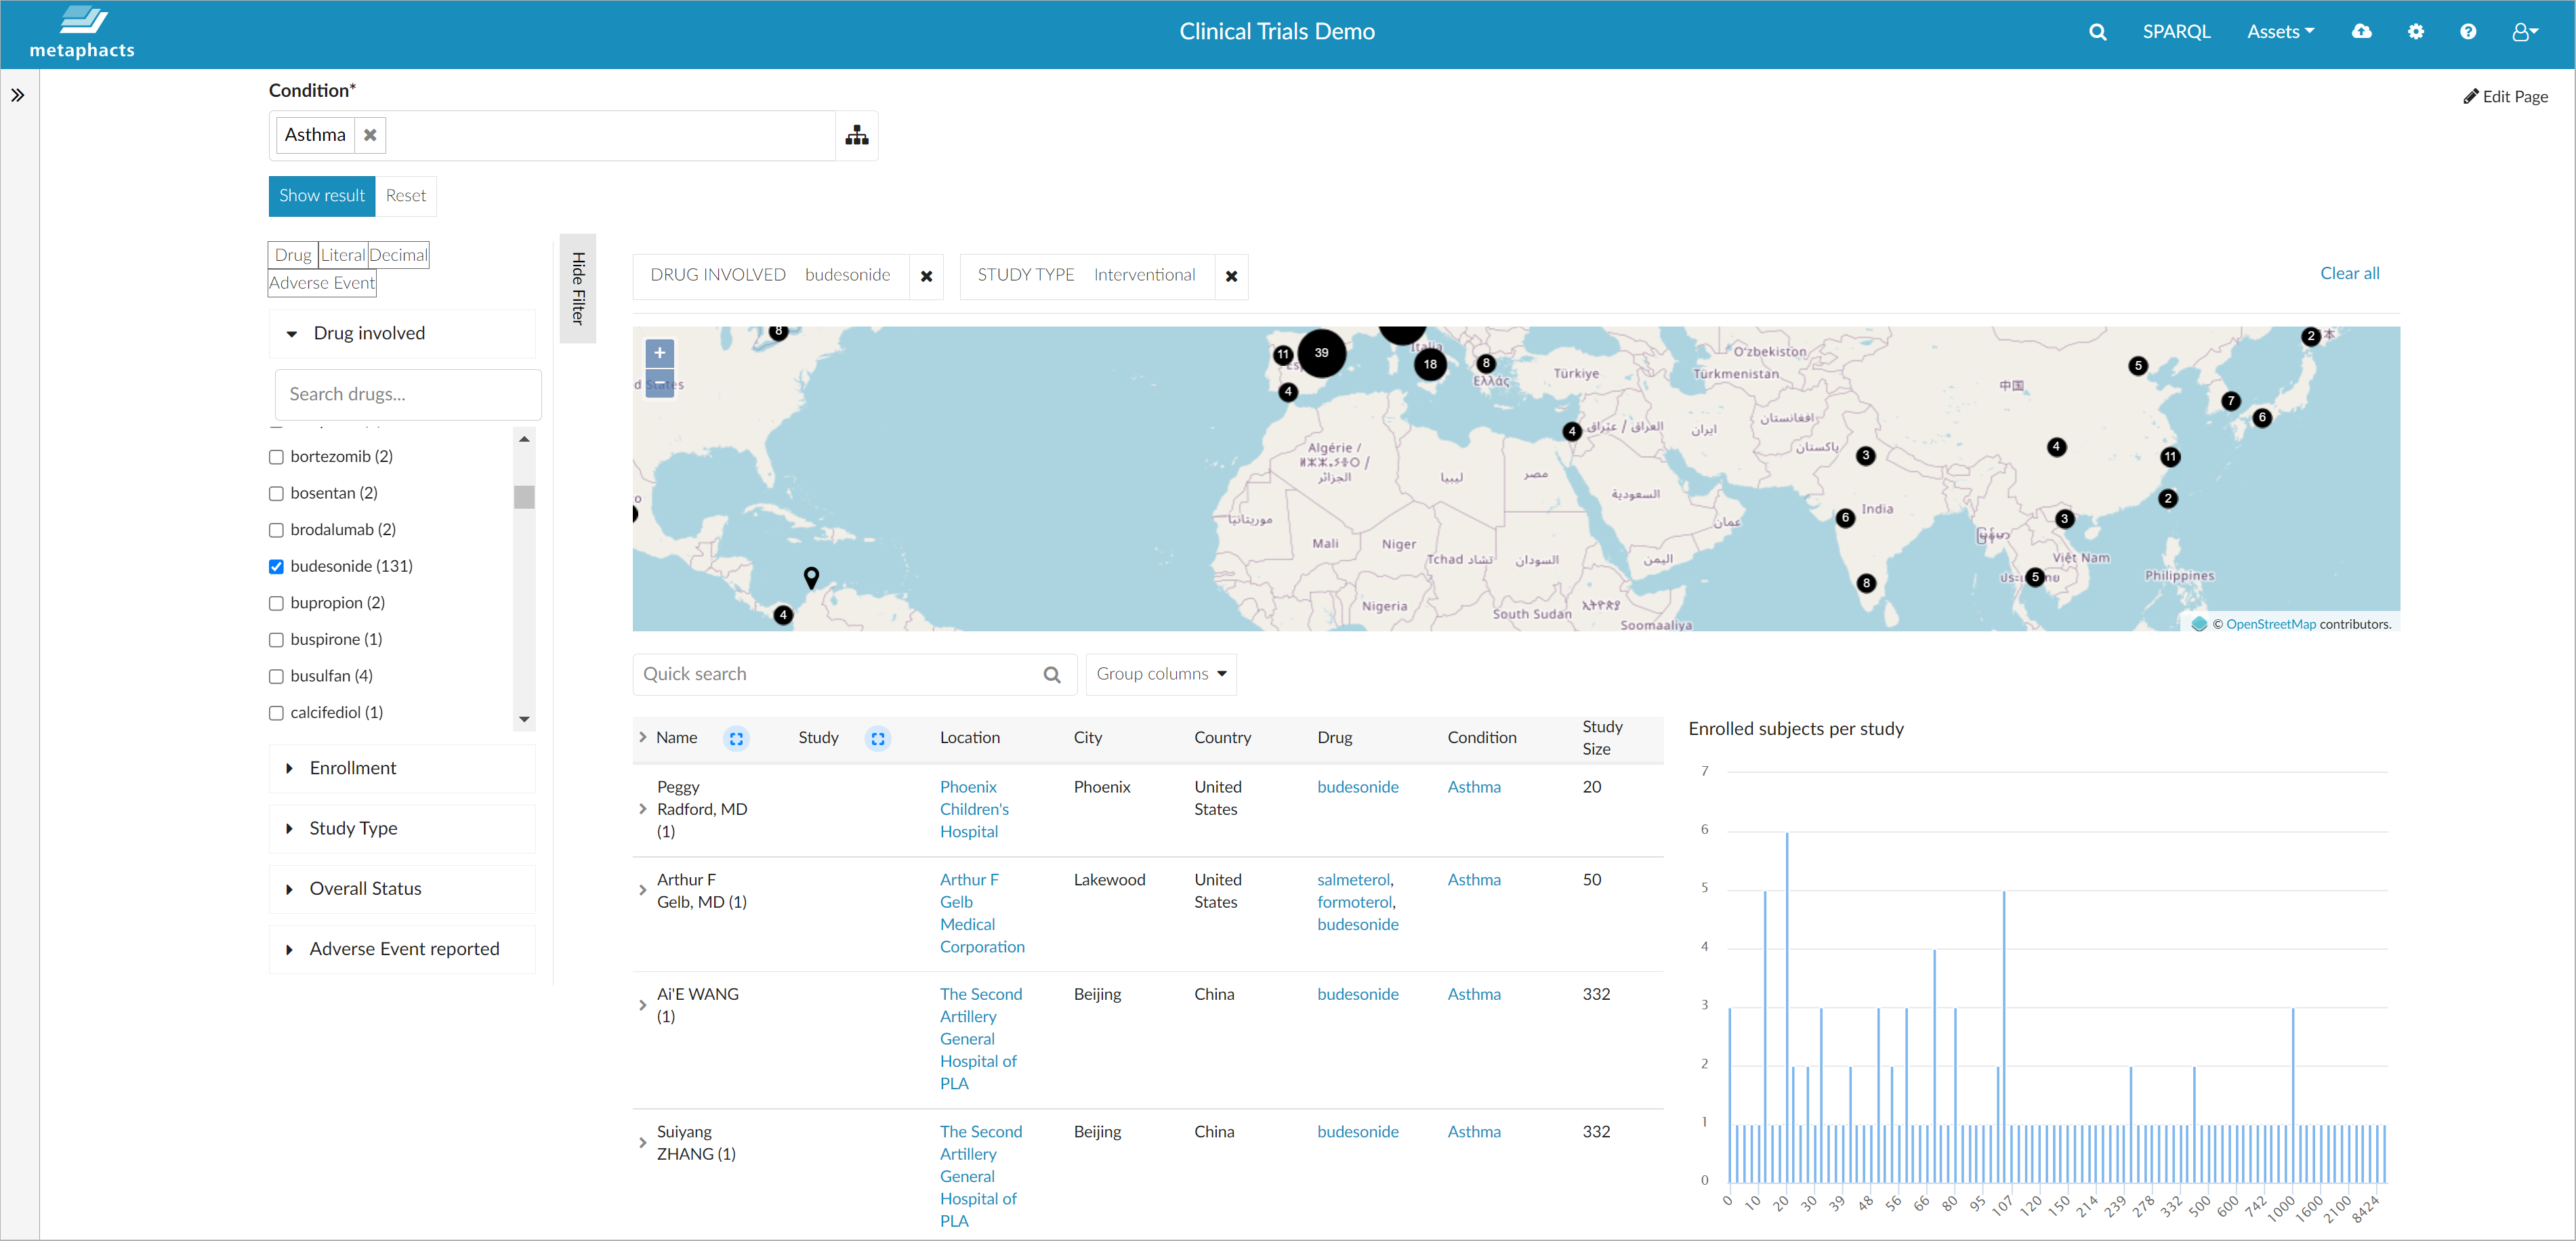
You can also filter and refine the results further along the relations available in the knowledge graph (for example, if you are only interested in specific study types) or you can limit the result set to a specific drug involved in the studies.
When using the interactive facets to select a specific drug or a specific study type, all visualizations are updated dynamically and you see only information specific to that sub-selection of your graph.
Building a Knowledge Graph Application with metaphactory
If you're wondering how this interactive dashboard was created, the answer is simple. This result page is an HTML markup that organizes the way the information is displayed (see the screenshot below). We have several metaphactory components at work here: a semantic table, several charts and a semantic map.
All these components are included in metaphactory's component library and can be configured using SPARQL queries. Looking at the map component in more detail, it is worth mentioning that the coordinates for the various locations were not available in the FROCKG knowledge graph, so we made them available through federation over Wikidata and OpenStreetmap. After that, we used simple parameterization to define things such as the zoom level for the map.
That's all you need to do in order to build a UI using metaphactory's low-code approach. And you can achieve all this without the help of experienced application developers.
To Sum It Up
This concludes our overview of the joint solution provided by Ontotext and metaphacts to speed up your knowledge graph journey and quickly generate value from it. If you have already built your graph with GraphDB, you can use the metaphactory platform connected with GraphDB to get a ready-to-use application in a matter of days.
With the RDF database and the knowledge graph platform in action, you get a cross-functional, human and machine- understandable Data Fabric. And you can start using it immediately to provide an integrated view of all your data and allow your end users to consume this data and extract actionable insights from it.
Because the interface built with metaphactory is data- and model-driven, it immediately reacts to changes in the data or the model and allows you to quickly integrate and utilize new data or adjust the user experience to address new business needs with little to no effort. The metaphacts and Ontotext joint solution supports organizations in their digital transformation journey; it allows them to create targeted solutions for specific business use cases or datasets and combine these into an integrated experience where end users can visualize and interact with the data points relevant for their work. Furthermore, the low-code approach helps increase data literacy in the enterprise by supporting self-empowered business teams in building such targeted solutions or knowledge graph applications without the help of IT departments.
That's cool, how can I get started?
You can get started with metaphactory using our 14-day free trial; GraphDB is also available for a trial in various editions here.
Don't hesitate to reach out if you want to learn more about our joint solution based on GraphDB and metaphactory and make sure to also subscribe to our newsletter or use the RSS feed to stay tuned to further developments at metaphacts.


