
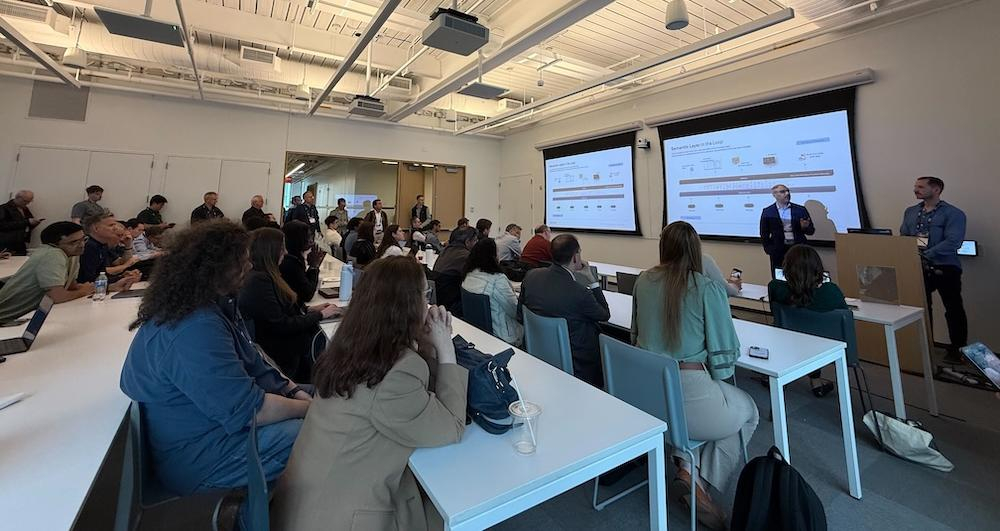
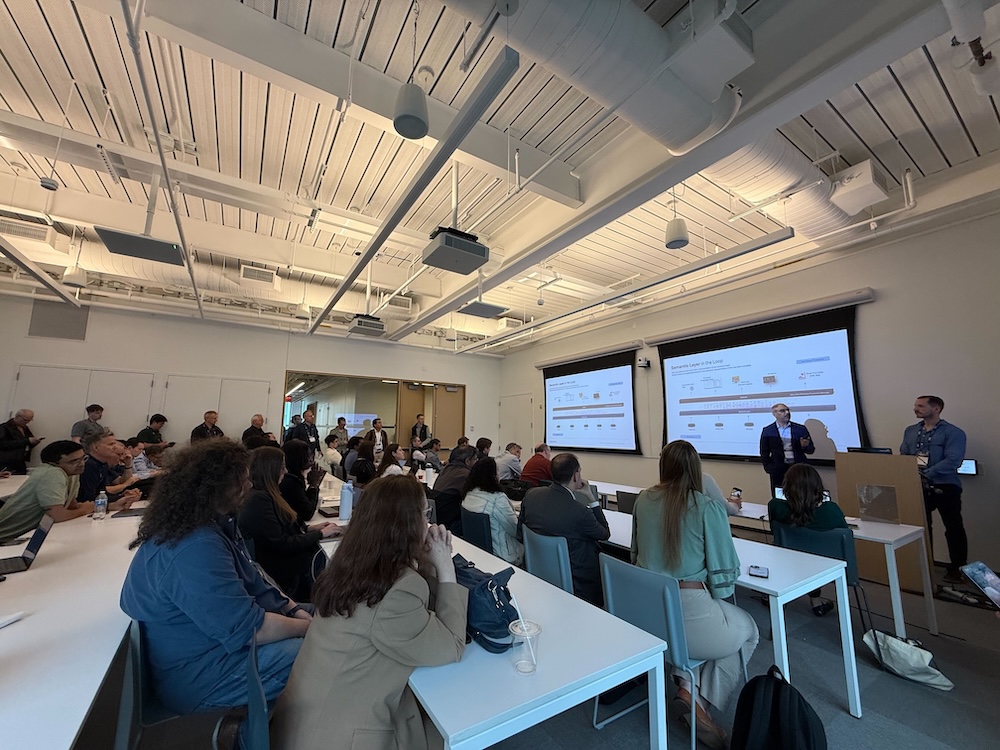
We had the great opportunity to present at the Knowledge Graph Conference 2026, for another year in a row. In this article, we recap our featured session titled "From Raw Data to Governed Insights," where experts from Morgan Stanley and metaphacts (Digital Science) detailed a cutting-edge approach to enterprise data management. Keep reading for key takeaways!
A knowledge graph journey with Morgan Stanley and Digital Science
The Knowledge Graph Conference (KGC) 2026 featured a standout session titled "From Raw Data to Governed Insights," where experts from Morgan Stanley and metaphacts (Digital Science) detailed a cutting-edge approach to enterprise data management. This presentation, led by Muhammad Javed, Ph.D., Head of Ontology & Semantic Modeling at Morgan Stanley’s Legal & Compliance Division, alongside metaphacts' Ademar Crotti Junior, Ph.D., Principal Technical Consultant, showcased the power of the Non-Financial Risk (NFR) Semantic Layer.
Non-Financial Risk refers to any risk that does not stem directly from market movements, credit defaults, or liquidity issues, for example, operational, compliance, conduct, cyber risks, and others.
The session focused on how to transform vast amounts of raw data into high-fidelity, consumable, and governed insights for use by machine assistants and AI. To view a recording of the session, you can view it online here.
Before this initiative, while a semantic layer existed, a high-stakes problem was that the Legal and Compliance Division did not have the necessary functional curated datasets that are based on the semantic layer. Though ontologies were built, the challenge was ensuring the semantic layer could talk about all of the data, regardless of how it was materialized and consumed, to address data management pain points.
Three core pillars
The presentation outlined a strategic approach centered on three core pillars:
Functional datasets and the medallion architecture
The goal of the project was to create specialized, curated functional datasets that comply with data quality standards and have transparent data lineage. This was achieved by following the Medallion Architecture, which structured data into three layers—bronze (raw), silver (processed), and gold (aggregated)—to ensure gradual quality improvement.
The semantic layer in the loop
This layer was critical for connecting various data sources (Graph, Tabular, XML, JSON) and ensuring that every raw data concept had a semantic representation. The semantic layer then defines the representation of schemas, semantic models, taxonomies, metadata, and mappings. This enabled data access and presentation for reporting, AI agents, and a holistic "Know Your Data (KYD 360)" view. The semantic layer then needed to be exposed to different user types. Business domain experts required specific views to visualize and validate data models at different levels. There were three main views developed using metaphactory. Onto-Viewer was developed to visualize and explore the ontology models in graph as well as in tabular format. Technical users, on the other hand, needed views for Physical Data Element (PDE) mapping that translate the schema representation to the semantic models. To ensure clarity for all users, a Dataset Field Viewer was implemented to present metadata about the dataset, allowing users to access detailed information, including lineage and source.
Governance and the context graph
The Semantic Layer established a common semantic foundation for Analytics and AI, including the governance of domain terminologies (Glossaries and Taxonomies) and the Semantic representation of Domain Concepts (Ontology Models). The final step was building a Context Graph from the existing Semantic Layer with additional information in order to enable advanced use cases like Conversational AI, which has been developed using metis. This implementation is currently at the QA level and is in discussion for the next round of approvals. The ultimate goal for this solution is not only to talk to domain data but to all and any data, including data lineage, domain data, and ontology data, all brought together in the semantic layer.
The success of this NFR Semantic Layer approach is demonstrated by several key results. Business units that don’t traditionally engage with graphs are now engaging with the models and data available in the knowledge graph. The project has improved Morgan Stanley’s understanding of its own data and has been instrumental in managing the Legal and Compliance Division data, with metadata providing all the necessary background.
The session clearly demonstrated that the principles and technologies for moving from raw data chaos to governed insights are applicable to every data-driven enterprise.
Adding color with metaphacts
The capabilities highlighted in this session—from building a semantic layer to visualizing complex data models—are often made possible through powerful knowledge graph platforms. Digital Science’s metaphactory platform is designed precisely for this kind of enterprise transformation.
metaphactory is an enterprise knowledge graph-based platform that uses semantic knowledge modeling and knowledge discovery to turn data into consumable, contextualized, and actionable knowledge. It helps organizations:
- Eliminate ambiguity by adding context and capturing the meaning of data, enabling the creation of a sophisticated semantic layer for enterprise architecture.
- Drive trustworthy AI by grounding LLM-driven applications in the explicit relations defined in the knowledge graph, enhancing their explainability and accuracy.
- Accelerate innovation by using a model-driven approach to rapidly prototype applications, saving significant time and financial investment.
metaphactory is an essential tool for organizations looking to move from siloed data to connected, meaningful, and AI-ready knowledge that drives forecasts and strategic decisions.
Ready to transform your data into actionable knowledge?