metaphacts Blog
Our blog strives to deliver content, ideas & inspiration to guide & support you on your journey into the world of Knowledge Graphs
Our blog strives to deliver content, ideas & inspiration to guide & support you on your journey into the world of Knowledge Graphs
Reading time: 7 - 13 minutes

In a previous blog post we provided a high-level overview on security-related topics for using metaphactory in an enterprise environment. This post will dive deeper into authentication and authorization using single sign-on and also cover how the authentication process can be integrated with databases or external services such as third-party REST endpoints.
Reading time: 6 - 12 minutes
The terms "ontology" and "vocabulary" are often used interchangeably. However, more often than not, this leads to confusion among customers who want to semantically model their domain and results in questions about whether there is in fact a distinction between the two and whether both are needed to implement a knowledge graph.
The meta-layers that these terms describe have been captured by different standards (OWL and SKOS respectively) and we at metaphacts believe that there is value in treating both as individual but complementary assets in their own right.
Reading time: 7 - 13 minutes

For many of our customers, metaphactory is a key component of their data landscape: their knowledge graph ties together various data silos, provides a semantic access layer based on semantic models, and becomes one of the key systems to support decisions and processes from research to sales.
Keeping all involved systems up and running is a big task that requires many different skills. Besides the operational perspective of working with infrastructure, development, and deployment processes, security plays a growing part in this story.
Reading time: 4 - 8 minutes

Forms are a key instrument for collecting and authoring data, while knowledge graphs are the de facto standard for modeling and representing human knowledge. metaphactory delivers a highly configurable semantic form component that empowers you to build user-friendly form interfaces based on the semantic model (ontology1) in the underlying knowledge graph. End users can use these form interfaces to edit existing data, create new data, and interlink resources in the knowledge graph.
In this blog post, we will provide an introduction to semantic forms in metaphactory and discuss how they support data authoring use cases on top of knowledge graphs. To demonstrate how metaphactory's semantic forms work in practice, we will look at a practical example and will augment the Nobel Prize Dataset with information about scholarly articles. The Nobel Prize Dataset is a public dataset available as a Semantic Knowledge Graph, i.e., it is published in RDF and described by an OWL ontology. We extended the ontology with SHACL shapes to also model relevant constraints which can be utilized within the forms. The ontology and dataset include information about all Laureates (Persons, Organizations) who have received a Nobel Prize Laureate Award in a certain Category, or a share thereof, ever since the inception of the Nobel Prize2. Our aim will be to extend this information to include details about scholarly articles published by these laureates.
Reading time: 8 - 15 minutes
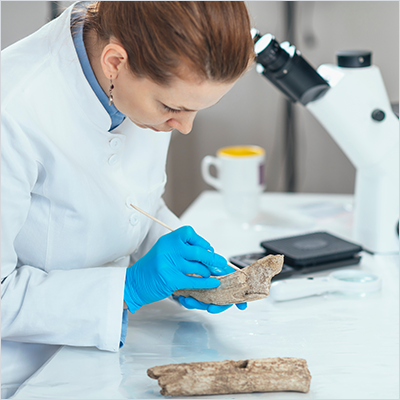
This blog post is co-authored by Felix Engel and Stefan Schlager. Felix and Stefan work for the department of Biological Anthropology at the University of Freiburg where they lead the development of AnthroGraph – an application that researchers can use to model anthropological data as knowledge graphs and intuitively explore, visualize and find information. In this guest post for the metaphacts blog, they explain how metaphactory was used as the development framework for AnthroGraph and how the resulting application can support the standardization of research data and the creation of reliable, curated and reusable collections of osteological research, ultimately allowing researchers to collaborate across disciplines and perform large-scale analyses.